![]() Pandas is an excellent Python librarie to manage data. Matplotlib allows to create advanced charts and Openpyxl is very usefull to read/write Excel files. These 3 tools, combined with other classic Python features, allow to do data analysis and engineering.
Pandas is an excellent Python librarie to manage data. Matplotlib allows to create advanced charts and Openpyxl is very usefull to read/write Excel files. These 3 tools, combined with other classic Python features, allow to do data analysis and engineering.
Here we will use PyCharm (Community Edition), but it is not mandatory.
First install or check Python and Pip, then the 3 libraries:
pip install pandas
pip install matplotlib
pip install openpyxl
PyCharm/Pip
Few tips if you notice inconsistencies between the versions of libraries installed with PyCharm depending on your version of Python (which can happen if you use multiple versions of Python).
Force Pip to install a specific library version in a specific Python version
C:\Users\Georges\AppData\Local\Programs\Python\Python39\python.exe -m pip install --force-reinstall "pandas==2.3.0"
Requirements
pip freeze
pip freeze > requirements.txt
Better, to be sure to print from a specific Python version:
C:\Users\Georges\AppData\Local\Programs\Python\Python39\python.exe -m pip freeze
Uninstall
C:\Users\Georges\AppData\Local\Programs\Python\Python39\python.exe -m pip uninstall mysql-connector
Reinstall from requirements
C:\Users\Georges\AppData\Local\Programs\Python\Python39\python.exe -m pip install --upgrade --force-reinstall -r C:\Users\Georges\PycharmProjects\Tests\requirements.txt
Read/export data file (CSV, Excel, MySQL, Postgres, JSON, Shape ...)
Read and display an Excel file
import pandas as pd
from tabulate import tabulate

df = pd.read_excel('C:/Users/Your file.xlsx',
                   sheet_name='Export', engine='openpyxl', usecols=['My first column', 'My second column'])

print(tabulate(df.head(35), headers='keys', tablefmt='psql', showindex=True))
I set engine='openpyxl' because it is from an XLSX file. sheet_name specifies the sheet to import, specify your columns with usecols.
Then I use tabulate to display properly my data in a Postgres way (tablefmt='psql').
With head(35) I just display the 35 first lines, but the dataframe here named df contains all the data.
If you wan to re-organize the columns, please see the Miscellaneous chapter.
Read a CSV file
import pandas as pd
from tabulate import tabulate

df_subscriber = pd.read_csv(workDirectory+'joo_acymailing_subscriber.csv', sep=';', usecols=['subid', 'source', 'email'])

print(tab(df_subscriber.head(10), headers='keys', tablefmt='psql', showindex=False))
Add textual column names from a CSV without column names
Use names=[] :
import pandas as pd
from tabulate import tabulate

df = pd.read_csv(inpuMyFilePath, names=['Mon Champ 1', 'Mon Champ 2', 'Mon Champ 3'], sep=',', keep_default_na=False).astype(str)

print(tabulate(df.head(10), headers='keys', tablefmt='psql', showindex=False))
Read a non-standard Excel file
Sometimes a file has wrong top lines, or you can not trust the future column names.
To read a file from a specific row for example, skipping the last rows.
import pandas as pd
from tabulate import tabulate

df = pd.read_excel(r'C:/Users/Georges/Downloads/test excel.xlsx',
sheet_name='Sheet1', engine='openpyxl', usecols=[0,1], header=5-1, skipfooter=1, names=['id', 'value'])

print(tabulate(df.head(35), headers='keys', tablefmt='psql', showindex=False))
Or skip a specific line (with skiprows=[...]):
...
df = pd.read_excel(my_file, sheet_name='Feuil1', engine='openpyxl', skiprows=[2])
...
Use first row as label column
my_labels = df.iloc[0]
df = df[1:]
df.columns = my_labels
Read from MySQL with sqlalchemy
sqlalchemy is the best way with pandas:
from tabulate import tabulate as tab
import pandas as pd
from sqlalchemy import create_engine

username = 'root'
password = ''
port = 3308
database = 'my_beautiful_db'
host ='localhost'

engine = create_engine('mysql+mysqldb://%s:%s@%s:%i/%s' % (username, password, host, port, database))
sql = 'SELECT COUNT(*) AS total FROM communes ;'
df = pd.read_sql_query(sql, engine).set_index('total')

print(tab(df.head(5), headers='keys', tablefmt='psql'))

engine.dispose()
Specify database encoding
engine = create_engine('mysql+mysqldb://%s:%s@%s:%i/%s?charset=utf8mb4' % (username, password, host, port, database))
Read one result/cell from MySQL with sqlalchemy
from sqlalchemy import create_engine, text

engine = create_engine('mysql+mysqldb://%s:%s@%s:%i/%s' % (userDb, passwordDb, hostDb, portDb, databaseDb))
sql = 'SELECT 1 ;'

with engine.connect() as my_connection:
   my_query = my_connection.execute(text(checkSql)).scalar()

print(my_query)
Read from MySQL with mysqlclient
import MySQLdb
from tabulate import tabulate
import pandas as pd

mydb = MySQLdb.connect(user='root', password='', database='MyDb', host='localhost', port=3306)
query = 'SELECT name FROM users ;'

df = pd.read_sql(query, mydb)
mydb.close()

print(tabulate(df.head(10), headers='keys', tablefmt='psql'))
number = df.shape[0]
print(number)
Read from MySQL with mysql.connector
import mysql.connector as connection
import pandas as pd
from tabulate import tabulate as tab

mydb = connection.connect(host='XXX.XX.XXX.XX', port=3308, database='MyDb',user='Me', passwd='pwdXXX!456', use_pure=True)

try:
    query = "SELECT firstname, lastname FROM customer ;"
    df = pd.read_sql(query, mydb)
except Exception as e:
    mydb.close()
    print(str(e))

print(tab(df.head(5), headers='keys', tablefmt='psql'))
Read from Postgres (psycopg2 is your friend!)
import pandas as pd
from tabulate import tabulate
import psycopg2

con = psycopg2.connect(database='mytransformations', user='postgres', password='', host='localhost', port='5432')
print("OK, we are connect to mytransformations")

# DISPLAY WITH PANDAS
df = pd.read_sql("SELECT * FROM myparcels ;", con)
con.close()

df.drop('geom', axis=1, inplace=True)

print('\nResults:')
print(tabulate(df.head(10), headers='keys', tablefmt='psql', showindex=False))
print('Number of records:', df.shape[0])
Read from a JSON
import pandas as pd
from tabulate import tabulate
import json
import requests

response = requests.get(MON_URL)
my_file = json.loads(response.text)
my_json = my_file['data']

mon_df = pd.DataFrame.from_dict(my_json)
Read from a shape (ESRI)
Use geopandas:
import geopandas as gpd
from tabulate import tabulate

myShape = 'C:\\Path\\Of\\My\\Shape.shp'

print('\n' + myShape)

df = gpd.read_file(myShape)
df['type'] = df['geometry'].astype(str).str.replace(r' .*|\(.*', '', regex=True)
df = df[['id', 'type', 'geometry']]

print(tabulate(df.head(10), headers='keys', tablefmt='psql', showindex=True))
print(df.shape[0])

MyFieldList = df['id'].drop_duplicates().dropna().sort_values(ascending=False).tolist()
print('\n' + str(MyFieldList))

MyGeomTypeList = df['type'].drop_duplicates().dropna().sort_values(ascending=False).tolist()
print('\n' + str(MyGeomTypeList))
You can also read the DBF only:
import pandas as pd
from dbfread import DBF

myDbf = DBF(myPath + '\\myDbfFromShape.dbf', encoding='cp1252')
dfCheckShape = pd.DataFrame(iter(myDbf))
Export a data-frame in a new Excel file
df.to_excel("C:/Users/Your new file.xlsx", index=False, sheet_name='Tab 1')
index=False to not get the index column.
Export a data-frame in an existing Excel sheet
Use mode='a' and if_sheet_exists:
from openpyxl import load_workbook
import openpyxl

My_File_Path= 'C:/My/File.xlsx'

with pd.ExcelWriter(My_File_Path, 'openpyxl', mode='a', if_sheet_exists='replace') as writing:
    df.to_excel(writing, 'My sheet', index=False)
Export several dataframes in Excel sheets
If you have several data-frame to export in one Excel file, each in unique sheets, you should open an ExcelWriter. And close it.
writer = pd.ExcelWriter('C:/Users/Your new file.xlsx', engine='xlsxwriter')

df_Country.to_excel(writer, index=False, sheet_name='Country', header=['Country', 'Total'])
df_Emails.to_excel(writer, index=False, sheet_name='Emails', header=['Emails', 'Total'])

writer.save()
Export several dataframes in the same file in specific sheets
writer = pd.ExcelWriter('C:/Users/Your new file.xlsx', engine='xlsxwriter')

df.to_excel(writer, index=False, sheet_name='Registrations', startcol=3, startrow=34, header=['Filed', 'Total', '%'])
Export a dataframe as a txt file, with separator and ANSI encoding
df.to_csv(my_file_import, header=None, index=None, sep='\t', encoding='mbcs')
Add filters in all columns in one sheet in an Excel file
import openpyxl
from openpyxl.utils import get_column_letter

outputExcelFile = r'C:/User/Your file.xlsx'
workbook = openpyxl.load_workbook(outputExcelFile)

worksheet = workbook['Sheet name']
FullRange = 'A1:' + get_column_letter(worksheet.max_column) + str(worksheet.max_row)
worksheet.auto_filter.ref = FullRange

workbook.save(outputExcelFile)
Add filters in all columns in all sheets in an Excel file
import openpyxl
from openpyxl.utils import get_column_letter

outputExcelFile = r'C:/User/Your file.xlsx'

workbook = openpyxl.load_workbook(outputExcelFile)
sheetsLits = workbook.sheetnames

for sheet in sheetsLits:
    worksheet = workbook[sheet]
    FullRange = 'A1:' + get_column_letter(worksheet.max_column) + str(worksheet.max_row)
    worksheet.auto_filter.ref = FullRange
    workbook.save(outputExcelFile)
Add colors in all column names in a sheet in an Excel file
import openpyxl
from openpyxl.styles import PatternFill

workbook = openpyxl.load_workbook(My_File_Path)
worksheet = workbook['My sheet']

for cell in worksheet[1]:
    worksheet[cell.coordinate].fill = PatternFill(fgColor='FFC6C1C1', fill_type='solid')
    workbook.save(My_File_Path)
Add colors in all column names in all sheets in an Excel file
import openpyxl
from openpyxl.styles import PatternFill

outputExcelFile = r'C:/Users/Your File.xlsx'

workbook = openpyxl.load_workbook(outputExcelFile)
sheetsLits = workbook.sheetnames

for sheet in sheetsLits:
    worksheet = workbook[sheet]
    for cell in workbook[sheet][1]:
        worksheet[cell.coordinate].fill = PatternFill(fgColor = 'FFC6C1C1', fill_type = 'solid')
        workbook.save(outputExcelFile)
Modify a column width in one sheet in an Excel file
import openpyxl

outputExcelFile = r'C:/Users/Your File.xlsx'

workbook = openpyxl.load_workbook(outputExcelFile)
sheetsLits = workbook.sheetnames

workbook['Your sheet'].column_dimensions['A'].width = 75
workbook.save(outputExcelFile)
Modify all columns width in all sheets in an Excel file
The code below set the A column size to 30, and the others to 10.
import openpyxl
from openpyxl.utils import get_column_letter

outputExcelFile = r'C:/Users/Your File.xlsx'

workbook = openpyxl.load_workbook(outputExcelFile)
sheetsLits = workbook.sheetnames

for sheet in sheetsLits:
    for cell in workbook[sheet][1]:
        if get_column_letter(cell.column) == 'A':
            workbook[sheet].column_dimensions[get_column_letter(cell.column)].width = 30
        else:
            workbook[sheet].column_dimensions[get_column_letter(cell.column)].width = 10

        workbook.save(outputExcelFile)
Add color to some line recovering their indexes from condition
list_duplicate = df.index[df['Ligne en doublon'] == 'DOUBLON !'].tolist()

for index in list_duplicate:
    for cell in worksheet[index+2]:
        worksheet[cell.coordinate].fill = PatternFill(fgColor='FF6666', fill_type='solid')
        workbook.save(My_File_Path)
Freeze the top row of an Excel file
worksheet.freeze_panes = 'A2'
Freeze the top row and the first column of an Excel file
worksheet.freeze_panes = 'B2'
Freeze the top row and the 2 first columns of an Excel file
worksheet.freeze_panes = 'C2'
Change font color and style in an Excel file
from openpyxl.styles import Font

worksheet['A1'].font = Font(color='FFFFFF', italic=False, bold=True)
Work on several Excel files
Here we freeze the top row, add filters, color and change the width of all columns from 3 Excel files.
import openpyxl
from openpyxl.utils import get_column_letter
from openpyxl.styles import PatternFill


File1 = r'D:/Work/My file 1.xlsx'
File2 = r'D:/Work/My file 2.xlsx'
File3 = r'D:/Work/My file 3.xlsx'

ExcelList = [File1, File2, File3]

for ExcelFile in ExcelList:
    workbook = openpyxl.load_workbook(ExcelFile)
    sheetsLits = workbook.sheetnames

    for sheet in sheetsLits:
        worksheet = workbook[sheet]
        FullRange = 'A1:' + get_column_letter(worksheet.max_column) + str(worksheet.max_row)
        worksheet.auto_filter.ref = FullRange
        worksheet.freeze_panes = 'A2'
        for cell in workbook[sheet][1]:
            worksheet[cell.coordinate].fill = PatternFill(fgColor='FFC6C1C1', fill_type='solid')
            if get_column_letter(cell.column) == 'A':
                workbook[sheet].column_dimensions[get_column_letter(cell.column)].width = 12
            else:
                workbook[sheet].column_dimensions[get_column_letter(cell.column)].width = 20
            workbook.save(ExcelFile)
Insert a picture in an Excel file
And delete them after.
img = openpyxl.drawing.image.Image('C:/Users/myplot.png')
img.anchor = 'E6'

workbook['Your sheet'].add_image(img)
workbook.save(outputExcelFile)

os.remove('C:/Users/myplot.png')
Open a box to search a file and get his path
Use Tkinter.
from tkinter import Tk
from tkinter.filedialog import askopenfilename

Tk().withdraw()
filename = askopenfilename()
print(filename)
Open a box to save an Excel file
from tkinter import Tk
from tkinter.filedialog import asksaveasfilename

fileName = asksaveasfilename(filetypes=(("Excel files", "*.xlsx"), ("All files", "*.*")), defaultextension='.xslx')
df.to_excel(fileName, index=False, sheet_name='Tab 1', header=None)
Check if a file exists
And use it only if it exists:
import os

my_file = 'C:/_gh/0/export.xlsx'
if os.path.isfile(my_file) == True:
    df_ExportFeuil1 = pd.read_excel(my_file, sheet_name='Feuil1', engine='openpyxl')
Rename a file
import os
os.rename('My file.xlsx', 'My file renamed.xlsx')
Search duplicate columns in Excel
from openpyxl import load_workbook

wb = load_workbook(filename=my_file)

Feuil1 = wb['Feuil1']

# Récupérer les noms de colonnes dans la 3ème ligne
noms_colonnes = [colonne.value for colonne in Feuil1[3]]
print(noms_colonnes)

# Vérifier les doublons dans les noms de colonnes
doublons = set()
noms_en_double = set()
for nom_colonne in noms_colonnes:
    if nom_colonne in doublons:
        noms_en_double.add(nom_colonne)
    else:
        doublons.add(nom_colonne)

# Afficher les noms de colonnes en doublons
if noms_en_double:
    print(colored('Attention colonne en doublon dans le fichier Excel :', 'red'))
    print(colored(str(noms_en_double).replace('{', '').replace('}', ''), 'red'))
    sys.exit()

else:
    print(colored('OK, pas de colonne en doublon dans le fichier Excel.', 'green'))
Get dataframe from lists
One list, one field
import pandas as pd
from tabulate import tabulate

print('\nONE LIST, ONE FIELD')
MyList = ['7878', 'Bbbb', 'azerfg', '545', 'XXX']
df = pd.DataFrame(MyList)
df.columns = ['My field']
number = df.shape[0]

print(tabulate(df.head(10), headers='keys', tablefmt='psql', showindex=False))
print(number)
Several lists in their own field, each list with same lenght
import pandas as pd
from tabulate import tabulate

print('\nSEVERAL LISTS IN THEIR OWN FIELD')
print('EACH LIST WITH SAME LENGHT')
MyList1 = ['7878', 'Bbbb', 'azerfg', '545', 'XXX']
MyList2 = ['Bruno', 'Constance', 'Mathieu', 'Abbes', 'Georges']

df = pd.DataFrame(
{'My field 1': MyList1,
'My field 2': MyList2
})

number = df.shape[0]

print(tabulate(df.head(10), headers='keys', tablefmt='psql', showindex=False))
print(number)
Several lists in the same field, lists with any lenght
import pandas as pd
from tabulate import tabulate

print('\nSEVERAL LISTS IN THE SAME FIELD')
print('LISTS WITH ANY LENGHT')
MyList1 = ['7878', 'Bbbb', 'azerfg', '545', 'XXX']
MyList2 = ['Bruno', 'Constance', 'Mathieu', 'Abbes']

df = pd.DataFrame(MyList1 + MyList2)
df.columns = ['My field']
number = df.shape[0]

print(tabulate(df.head(10), headers='keys', tablefmt='psql', showindex=False))
print(number)
Several lists from dictionaries, each list element as a field, lists with any lenght
import pandas as pd
from tabulate import tabulate

print('\nSEVERAL LISTS FROM DICTIONARIES')
print('EACH LIST ELEMENT AS A FIELD')
print('LISTS WITH ANY LENGHT')
MyList1 = ['Bruno', '11111', 'Rouge']
MyList2 = ['Constance', '22222', 'Jaune']
MyList3 = ['Mathieu', '33333', 'Bleu']
MyList4 = ['Abbes', '44444']

df = pd.DataFrame([MyList1] + [MyList2] + [MyList3] + [MyList4])
df.columns = ['My field 1', 'My field 2', 'My field 3']
number = df.shape[0]

print(tabulate(df.head(10), headers='keys', tablefmt='psql', showindex=False))
print(number)
A list from several lists from dictionaries, each sub-list as a row, each element from sub-list as a field, lists with any lenght
import pandas as pd
from tabulate import tabulate

print('\n LIST FROM SEVERAL LISTS FROM DICTIONARIES')
print('EACH SUB-LIST AS A ROW')
print('EACH ELEMENT FROM SUB-LIST AS A FIELD')
print('LISTS WITH ANY LENGHT')

MyList = [
    ['Bruno', '11111', 'Rouge'],
    ['Constance', '22222', 'Jaune'],
    ['Mathieu', '33333', 'Bleu'],
    ['Abbes', '44444']
]

df = pd.DataFrame(columns=['My field 1', 'My field 2', 'My field 3'], data=MyList)

number = df.shape[0]

print(tabulate(df.head(10), headers='keys', tablefmt='psql', showindex=False))
print(number)
Work with lists
Here below is not right about Pandas, but usefull in some Pandas contexts.
Search if elements from a list are in another list
Chek if elements from List2 are in List1:
import collections

List1 = ['Aaa', 'Bbbb', 'Cccc', 'Dddd', 'Eeee', 'Ffff', 'Gggg', 'Hhhh']
List2 = ['Eeee', 'Cccc']

print(List1)
print(List2)

check = all(item in List1 for item in List2)

print(check)
Or:
import collections

List1 = ['Aaa', 'Bbbb', 'Cccc', 'Dddd', 'Eeee', 'Ffff', 'Gggg', 'Hhhh']
List2 = ['Bbbb', 'Aaa', 'Cccc', 'Dddd', 'Eeee', 'Ffff', 'Hhhh', 'Gggg']

print(List1)
print(List2)

def iCompare(c1, c2):
    if(collections.Counter(c1)==collections.Counter(c2)):
        return 'Yes'
    else:
        return 'No'

info = iCompare(List1, List2)

print(info)
Extract common elements from several lists
listeAttributaire = []
listeGeometrique = []
...

listes = [listeAttributaire, listeGeometrique, ...]

communs = set(listes[0]).intersection(*listes[1:])

resultat = list(communs)

print('\n' + str(len(resultat)) + ' commune(s) :')
print(resultat)
Extract no-common elements from several lists
List1 = ['Aaa', 'Aaa', 'Bbbb', 'Cccc', 'Dddd', 'Eeee', 'Ffff', 'Gggg', 'Hhhh']
List2 = ['Eeee', 'Cccc', 'Cccc']

print('List1:', List1)
print('List2:', List2)

Compare = sorted(list(set(List1) - set(List2) ))

print('\nCompare:', Compare)
Concatenate 2 fields in list/sentence
Assemblage = list(zip(df['field1'].tolist(), df['field2'].tolist()))
b = []
for a in Assemblage:
    b.append('Blablabla...  ' + str(list(a)[0]) + ' ...Blablabla... ' + list(a)[1] + ' ...Blablabla.')
for i in b:
    print(i)
List all file from a directory in a Python list
repertoireCheck = 'E:/_CheckTables/'

listTxtFile = []

for path, subdirs, files in os.walk(repertoireCheck):
    for name in files:
        print(os.path.join(path, name))
        listTxtFile.append(os.path.join(path, name))

print(listTxtFile)
print(len(listTxtFile))
Split a big list in smaller sub-lists with a defined total
Here 750 records for example:
SubListsSize = 750
SubLists = [MyBigList[x:x+SubListsSize] for x in range(0, len(MyBigList), SubListsSize)]

for SubList in SubLists:
    print(SubList)
Better: split a big list in smaller sub-lists with a defined total in a function
def split_list(my_list, size_max):
    sublists = []
    for i in range(0, len(my_list),size_max):
       sublist = liste[i:i+size_max]
       sublists.append(sublist)
    return sublists

sublists = split_list(MyPersonalList, 10)
Create a list with sublists of the grouping of one field with values from another
resultat = [[k, v['valeur'].tolist()] for k, v in df.groupby('groupe')]
print(resultat)
Combining two lists containing couple sublists (2 values in each sublist)
l1 = [(59332, 6), (95002, 3), (33232, 9)]
l2 = [(33232, 'E'), (59332, 'K'), (95002, 'Z')]

d2 = {k: v for k, v in l1}
newList = [(k, v1, d2[k]) for k, v1 in l2 if k in d2]

print(newList)
Advanced read/write in Excel
Formulas
Write formula
No problem to create Excel formulas with Pandas, but use these tips below.
- As you will use simple and double quote in your formulas, frame your string with triple quotes.
- Translate in english all Excel keywords (IF, CHAR, SUBSTITUTE...).
- Use a simple comma to separate your parameters (english...).
- Re-sort your dataframe and reset your index before the formula:
df.sort_values(by=['Your Id'], ascending=True, inplace=True)
df = df.reset_index(drop=True)
- Start the index with a special value (to start with 2, as usual in Excel):
df.index = df.index + 2
- Then use the index as a string in your formula:
'''...''' + df.index.astype(str) + '''...'''
- Do not add other sorts after the formulas creation, it causes index issues and impacts your formulas.
Read formula
Sometime you want read formula as string. If the Excel file was created by Excel himself, no problem, just use data_only=True:
wb = openpyxl.load_workbook('My file.xlsx', data_only = True)
ws = wb['My tab']
df = pd.DataFrame(ws.values)
print(tabulate(df.head(5), headers='keys', tablefmt='psql', showindex=False))
But if the file, and the formulas, was created with Python, so the Excel cache do not know your formulas and... oups!So just open and close your file before to use
data_only=True:import xlwings ... excel_app = xlwings.App(visible=False) excel_book = excel_app.books.open('My file.xlsx') excel_book.save() excel_book.close() excel_app.quit()
Formating
Set font in blue, bold and centered:
import openpyxl
from openpyxl.styles import Font, PatternFill, Fill, Alignment

myFile = 'C:/Path/test.xlsx'

myDF.to_excel(myFile, index=False, sheet_name='Tab 1')

workbook = openpyxl.load_workbook(myFile)
worksheet = workbook['Sheet1']

font = Font(color='1469BE', bold=True)
alignment = Alignment(horizontal='center')
column = 'B'

for cell in worksheet[column][1:]:
    cell.font = font
    cell.alignment = alignment

workbook.save(myFile)
Conditional formatting
If a number is equal to, in just one cell
Here we add in one cell (B3) a rule to fill it in blue if it equals to 2:
import openpyxl
from openpyxl import styles, formatting

myFile = 'C:/Path/test.xlsx'

myDF.to_excel(myFile, index=False, sheet_name='Tab 1')

workbook = openpyxl.load_workbook(myFile)
worksheet = workbook['Sheet1']

myBlue = styles.PatternFill(start_color='0088cc', end_color='0088cc', fill_type='solid')
worksheet.conditional_formatting.add('B3', formatting.rule.CellIsRule(operator='equal', formula=['2'], fill=myBlue))

workbook.save(myFile)
If a number is greater than, in whole column
Same as above, we just change the operator with greaterThan and we target the whole column B as Excel did, with $1:$1048576:
import openpyxl
from openpyxl import styles, formatting

myFile = 'C:/Path/test.xlsx'

myDF.to_excel(myFile, index=False, sheet_name='Tab 1')

workbook = openpyxl.load_workbook(myFile)
worksheet = workbook['Sheet1']

myBlue = styles.PatternFill(start_color='0088cc', end_color='0088cc', fill_type='solid')
worksheet.conditional_formatting.add('B1:B1048576', formatting.rule.CellIsRule(operator='greaterThan', formula=['2'], fill=myBlue))

workbook.save(myFile)
Operators
The above method supports several operators:
{'beginsWith', 'endsWith', 'notBetween', 'notContains', 'lessThan', 'greaterThanOrEqual', 'notEqual', 'between', 'lessThanOrEqual', 'containsText', 'greaterThan', 'equal'}
If contains a string
For match with strings it is a little specific, with redundant code and building the column_slot ourself, using the size of our dataframe +1 :
Here for example we fill in red the cells from A column when contain the string CSS.
import pandas as pd
import openpyxl
from openpyxl import styles, formatting
from openpyxl.styles.differential import DifferentialStyle
from openpyxl.formatting.rule import Rule

myFile = 'C:/Path/test.xlsx'

myDF.to_excel(myFile, index=False, sheet_name='Tab 1')

workbook = openpyxl.load_workbook(myFile)
worksheet = workbook['Sheet1']

myRed = styles.PatternFill(start_color='ffc7ce', end_color='ffc7ce', fill_type='solid')

column_slot = 'A2:A'+str(myDF.shape[0]+1)

styleRed = DifferentialStyle(fill=myRed)
rule = Rule(type='containsText', operator='containsText', text='css', dxf=styleRed)
rule.formula = ['SEARCH("css",' + column_slot + ")"]
worksheet.conditional_formatting.add(column_slot, rule)

workbook.save(myFile)
Fix Excel percentage
When your data comes from an Excel file and contains percentages, something like dtype (search it in Miscellaneous chapter) will be non-efficient, because Excel stores percentages as numbers (indices between 0 and 1). The displaying with % is just a view. Actually 35% will be stored as 0.3 for example.
In addition, it is possible that these percentages are melted with true strings or numbers in the same columns, and sometimes with or without decimal ... Argghhh 🥵
But just relax:
import re
...
df[MyField] = df[MyField].apply(lambda x: str(round(float(x) * 100, 2)).rstrip('0').rstrip('.') + ' %' if re.search(r'^0\.\d+$|^0$|^1$',x) else x)
- Attention
- If the Excel file is wrong builded, melting true numbers between 0 and 1 with percentages, they will be converted. So maybe add red alerts to manage these special cases.
Search by lines
See the chapter Search by lines.
Build hyperlink
df['id_commune'] = '=HYPERLINK("https://my_site.com/blog?id=' + df['my_id'].astype(str) + '", "' + df['my_article'].astype(str) + '")'
Advanced write in a TXT file
Split file according to lines numbers
Here below is not right about Pandas, but usefull in some Pandas contexts.
First we count the number of lines in the file (from the recurrence of \n), then we split it in files with 50,000 lines if it exceeds 50,000 lines.
with open(workDirectory+'FixQueries.sql', 'r') as myfile:
data = myfile.read()
taille_fichier = data.count("\n")

lines_max = 50000
numero_fichier = 0
if taille_fichier > lines_max:
    print('Attention : le fichier de sortie fait '+str(taille_fichier)+' lignes ! Veuillez patienter...')
    smallfile = None
    with open(workDirectory+'FixQueries.sql') as bigfile:
        for lineno, line in enumerate(bigfile):
            if lineno % lines_max == 0:
                if smallfile:
                    smallfile.close()
                numero_fichier += 1
                small_filename = workDirectory + 'FixQueries {}.sql'.format(numero_fichier)
                smallfile = open(small_filename, "w")
            smallfile.write(line)
        if smallfile:
            smallfile.close()
            print('Nous l\'avons découpé en ', ceil(taille_fichier/lines_max), 'fichiers !\n')
    file1.close()
    os.remove(workDirectory+'FixQueries.sql')
And then merge the files:
filenames = ['C:/_gh/0/file_25000.txt', 'C:/_gh/0/file_50000.txt', 'C:/_gh/0/file_75000.txt', 'C:/_gh/0/file_100000.txt', 'C:/_gh/0/file_125000.txt']

with open('C:/_gh/0/CUMUL1.txt', 'w') as outfile:
    for names in filenames:
        with open(names) as infile:
            outfile.write(infile.read())
Maybe you will need to list the names of the files before to merge them, with PowerShell (Alt+F+R):
get-childitem | select-object -expandproperty name > _files_list.txt
- Attention 👈
- Be careful to keep the order of the file, to keep the last line empty.
Replace text in a file
my_file = r'C:/_gh/0/_Urbanisme/test.txt'

replacements = [
    ('heros', 'héros'),
    ('Batm?n', 'Batman'),
    ('télévisee', 'télévisée'),
    (' s attaquent', ' s\'attaquent')
]


with open(my_file, 'r') as file:
    data = file.read()

    for a, b in replacements:
        data = data.replace(a, b)

with open(my_file, 'w') as file:
    file.write(data)

# Confirm
print("OK !")
This is not right related to Pandas, but it is very useful to store some special note to remember during a data process, and automate it.
Create/replace a TXT file and write something into
Use the Write option (w):
MyTxtFile = 'C:/_gh/0/My beautiful file.txt'

with open(MyTxtFile, 'w') as file:
    file.write('Blablabla...\n')
    file.write(MyVariable)
Add some lines at the start of an existing file
MyTxtFile = 'C:/_gh/0/My beautiful file.txt'

with open(MyTxtFile, 'r') as original: data = original.read()
with open(MyTxtFile, 'w') as modified: modified.write('XPTDR\n' + data)
Add some lines at the end of an existing file
Use the Append option (a):
MyTxtFile = 'C:/_gh/0/My beautiful file.txt'

with open(MyTxtFile, 'a') as file:
    file.write('Blablabla...\n')
    file.write(MyVariable)
Replace some lines in an existing file
Here we first Read (r option) and store the content of the file, and then re-create it removing the lines we would delete:
MyTxtFile = 'C:/_gh/0/My beautiful file.txt'

with open(MyTxtFile, 'r') as f:
    lines = f.readlines()

with open(MyTxtFile, 'w') as f:
    for line in lines:
        if not line.strip('\n').startswith('First line to delete...') :
            if not line.strip('\n').startswith('Second line to delete...') :
                if not line.strip('\n').startswith('Third line to delete...') :
                    f.write(line)

with open(MyTxtFile, 'a') as file:
    file.write('New line 1')
    file.write('New line 2')
    file.write('New line 3')
Replace a simple string in a TXT file
MyTxtFile = 'C:/_gh/0/My beautiful file.txt'

with open(MyTxtFile, 'r') as file :
    filedata = file.read()

filedata = filedata.replace('String 1', 'String 2')

with open(MyTxtFile, 'w') as file:
    file.write(filedata)
Replace a string with a regular expression (regex) in a TXT file
FichierTest = 'C:/_gh/0/FichierTest.txt'

import re

# Find number : r'[0-9]'
# Find line break : r'[\n]'
# Find double line break : r'[\r\n]{2,}'

with open(FichierTest, 'r+') as file:
    text = file.read()
    text = re.sub(r'[\r\n]{2,}', '\n\n', text)
    file.seek(0, 0) # seek to beginning
    file.write(text)
    file.truncate() # get rid of any trailing characters
Merge 2 txt files
MyTxtFile1 = 'C:/_gh/0/My beautiful file 1.txt'
MyTxtFile2 = 'C:/_gh/0/My beautiful file 2.txt'
MyTxtFileMerged = 'C:/_gh/0/My beautiful file merged.txt'

with open(MyTxtFile1, 'r') as _MyTxtFile1: dataMyTxtFile1 = _MyTxtFile1.read()
with open(MyTxtFile2, 'r') as _MyTxtFile2: dataMyTxtFile2 = _MyTxtFile2.read()

with open(MyTxtFileMerged, 'w', encoding='utf-8') as _MyTxtFileMerged:
_MyTxtFileMerged.write(dataMyTxtFile1)
_MyTxtFileMerged.write(dataMyTxtFile2)

os.remove(MyTxtFile1)
os.remove(MyTxtFile2)
Test if a comma is used as decimal separator in a TXT file
with open(MyTxtFile, 'r') as myfile:
    data = myfile.read()
    pb_regex = re.findall(r'(?:\t|^)\d+\K,(?=\d+(?:\t|$))', data)
    if pb_regex:
        print(colored('\nAttention, comma is used as a decimal separator in numeric value!\n' +
        'Find them in Notepad with:\n(?:\\t|^)\d+\K,(?=\d+(?:\\t|$))', 'yellow'))
    else:
        pass
Write sentences from dataframe
MyTxtFile = WorkDirectory + ' - My file.txt'

with open(MyTxtFile, 'w') as file:
    file.write('\nSpecial cases:\n\n')

    Assemblage = list(zip(df['Field1'].tolist(), df['Field2'].tolist(), df['Field3'].tolist(), df['Field4'].tolist()))
    b = []
    for a in Assemblage:
        b.append('- ' + str(list(a)[0]) + ' ' + str(list(a)[1]) + ' (' + str(list(a)[2]) + ') in ' + str(list(a)[3]))
    for i in b:
        file.write(i + '\n')
Convert encoding
With chardet:
from chardet import detect

def get_encoding_type(file):
    with open(file, 'rb') as f:
        rawdata = f.read()
    return detect(rawdata)['encoding']

from_codec = get_encoding_type(MyOriginalFile)

if from_codec != 'utf-8':
    print(colored('Attention, script is ' + from_codec + '!', 'yellow'))

    try:
        with open(, 'r', encoding=from_codec) as f, open(MyNewFile, 'w', encoding='utf-8') as e:
            text = f.read()
            e.write(text)

        os.remove(MyOriginalFile)
        os.rename(MyNewFile, MyOriginalFile)

        print(colored('We converted the file as UTF-8.', 'yellow'))

    except UnicodeDecodeError:
        print('Decode Error')
    except UnicodeEncodeError:
        print('Encode Error')
With io:
import io

with io.open(OriginalTxtFile, mode='r', encoding='utf8') as fd:
    content = fd.read()

with io.open(FinalTxtFile, mode='w', encoding='cp1252') as fd:
    fd.write(content)
Replace a string with a dataframe in an existing txt file
Do a replace with a df.to_string(), maybe with a little regex to replace unwanted spaces.
with open(MtTxtFile, 'r') as file:
    MyTxtData = MyTxtData.replace('STRING TO REPLACE', df.to_string(header=False, index=False, justify='left'))
    MyTxtData = re.sub(r'^ *', '', MyTxtData, flags=re.MULTILINE)

with open(MtTxtFile, 'w') as file:
    file.write(MyTxtData)
Advanced read in a TXT file
Work data in a TXT file according the line number
You can grab data in a TXT file according the line number, or counting a number of lines before or after a specific string.
file = open('C:/Users/Georges/Downloads/MyFile.txt', 'r')
lines = file.readlines()

listSubject = []
listFirstname = []

for num, x in enumerate(lines):
    if x.startswith('Subject:\t'):
        listSubject.append(x)
        listFirstname.append(lines[num+6])

MergeLists = list(zip(listSubject, listFirstname))

df = pd.DataFrame(MergeLists, columns=['field Subject', 'field Firstname'])
Get encoding of a file
from chardet import detect

def get_encoding_type(file):
    with open(file, 'rb') as f:
        rawdata = f.read()
    return detect(rawdata)['encoding']

from_codec = get_encoding_type(MyFile)

print('from_codec')
print(from_codec)
Read a txt file containing a comma separated list of numbers and make a list in python
with open(pathFile, 'r') as myFile:
    fileContent = myFile.read()

    # You can add some formating if needy
    # fileContent = myFile.read().replace("'", '').replace('"', '')

myList = [int(myNumber) for myNumber in fileContent.split(',')]
Advanced SQL queries
Connection according to the database: MySQL
from sqlalchemy import create_engine

myEngine = create_engine('mysql+mysqldb://%s:%s@%s:%i/%s' % (username, password, host, port, database))
Connection according to the database: Postgres
from sqlalchemy import create_engine
import psycopg2

myEngine = create_engine('postgresql+psycopg2://%s:%s@%s:%i/%s' % (username, password, host, port, database))
Get one value from Postgres
con = psycopg2.connect(database='my_db', user='postgres', password='', host='localhost', port='5432')
cur = con.cursor()
cur.execute('SELECT COUNT(*) FROM my_table ;')
nbr_record = cur.fetchone()
nbr_record = nbr_record[0]
con.close()
print(nbr_record)
Execute simple query with sqlalchemy
With sqlalchemy, best way with Pandas.
from sqlalchemy import create_engine, text

engineSuppression = create_engine('mysql+mysqldb://%s:%s@%s:%i/%s' % (username, password, host, port, database))

sqlSuppression = '''DELETE FROM my_table WHERE id = 1;'''

with engineSuppression.connect() as conSuppression:
    conSuppression.execute(text(sqlSuppression))
    conSuppression.commit()
    print('\nid 1 supprimé !')
Execute SQL queries from a file with sqlalchemy
With sqlalchemy, best way with Pandas.
from sqlalchemy import create_engine, text
from sqlalchemy.orm import sessionmaker

my_engine = create_engine('mysql+mysqldb://%s:%s@%s:%i/%s?charset=utf8mb4' % (my_username, my_password, my_host, my_port, my_database))

my_sql_file = 'C:/MyQueries.sql'

# LOAD THE SQL SCRIPT
with open(queriesDirectory + my_sql_file, 'r') as sql_file:
    sql_script = sql_file.read()

# CREATE SESSION
my_session = sessionmaker(bind=my_engine)
session = my_session()

# START A TRANSACTION
session.begin()

try:
    session.execute(text(sql_script))
    print('Execution of "' + my_sql_file + '" finished!')
except:
    print('We can not execute "' + my_sql_file + '"!')
    pass

# VALIDATE THE TRANSACTION
session.commit()

# CLOSE SESSION AND CONNECTION
session.close()
my_engine.dispose()
Execute SQL queries from a file with mysqlclient
import MySQLdb
from termcolor import colored

conn = MySQLdb.connect(host='localhost',user='root',password='',database='ma_base',port=3308)

my_sql_file = 'C:/MyQueries.sql'

with open(sqlQueries, 'r', encoding='utf8') as sql_file:
    sql_script = str(my_sql_file.read())

try:
    cursor = conn.cursor()
    cursor.execute(sql_script)
    cursor.close()
    print(colored('\nOK!', 'green'))
except:
    print(colored('\nIssue!', 'red'))
    pass
Execute an SQL query in a function with sqlalchemy using with
Using with we are sure to open and close engine and connection properly!
Here an example searching if tables exist in a DB:
def isTableExistInTarget(myTable):

    sqlTableTargetExist = '''SELECT TABLE_NAME FROM information_schema.TABLES WHERE table_schema = \'''' + nameDbTarget + '''\' AND TABLE_NAME = \'''' + prefixTableTarget + myTable + '''\' ;'''

    with engineTarget.connect() as conTarget:
        myResultTarget = conTarget.execute(text(sqlTableTargetExist)).scalar()

    if myResultTarget == prefixTableTarget + myTable:
        myAnswerTarget = 'Yes'

    else:
        myAnswerTarget = 'No'

    return myAnswerTarget
Execute a lot of SQL queries from a dataframe in batch with sqlachemy
- Here we use a function named
escape_valueavailable somewhere in this article, lol, just add it if needy, or remove it. - Here we use
f{string}.
batch_queries = []
batch_size = 500

# SQL TO INSERT IN TARGET
for index, row in dfSource.iterrows():
    columns = ', '.join(row.index)
    values = ', '.join(f"'{escape_value(v)}'" for v in row.values)
    queryInsert = '''INSERT IGNORE INTO my_table''' + f'''({columns}) VALUES ({values}) ;'''

    # Add in batch
    batch_queries.append(queryInsert)

    # Run batch
    if len(batch_queries) == batch_size:
        # Build batch
        full_query = ' '.join(batch_queries)
        session.execute(text(full_query))
        print(str(len(batch_queries)) + ' queries in batch')
        # Empty batch
        batch_queries.clear()

# Queries out the last batch
if batch_queries:
    full_query = ' '.join(batch_queries)
    session.execute(text(full_query))
    print(str(len(batch_queries)) + ' queries in last batch')
Use percentage symbol in queries (%)
The percentage symbol is a special character with Python, so to use it in query, just mention the unicode string with u:
query = u'''UPDATE content SET introtext = REPLACE(introtext, 'XXX', 'ZZZ') WHERE introtext LIKE '%AAA%' ;'''
And maybe better to double it:
query = u'''UPDATE content SET introtext = REPLACE(introtext, 'XXX', 'ZZZ') WHERE introtext LIKE '%%AAA%%' ;'''
Escape some character in query
Another way to use special Python character in a function:
def escape_value(value):
    value_str = str(value)
    value_str = value_str.replace("\\", "\\\\")
    value_str = value_str.replace("'", "\\'")
    value_str = value_str.replace(":", "\\:")

    return value_str

...

values = ', '.join(f"'{escape_value(v)}'" for v in row.values)
...
Time out with sqlalchemy
If you experiment some connection/transaction issues, you can try this:
from sqlalchemy import create_engine

engineTarget = create_engine('mysql+mysqldb://%s:%s@%s:%i/%s' % (myUser, myPwd, myHost, myPort, myDb), connect_args={'connect_timeout': 60, 'read_timeout': 60, 'write_timeout': 60})
But personally I don't like this trick, it's not clear. When I have timeout problems, I prefer to make a function to check for good execution and to repeat the query if bad execution. Search here for Manage unexplained connection losses.
Connexions pool/queue pool with sqlalchemy
If you experiment some connection/transaction issues, you can try this:
from sqlalchemy import create_engine
from sqlalchemy.pool import QueuePool

engineTarget = create_engine('mysql+mysqldb://%s:%s@%s:%i/%s' % (myUser, myPwd, myHost, myPort, myDb), poolclass=QueuePool, pool_recycle=3600)
But personally I don't like this trick, it's not clear. When I have timeout problems, I prefer to make a function to check for good execution and to repeat the query if bad execution. Search here for Manage unexplained connection losses.
Manage unexplained connection losses with sqlalchemy
Sometimes, if you run a lot of specific queries, with different connections, different DBs, melting SELECT, UPDATE, UPDATE from a CONCAT, massive updates, PREPARE EXECUTE... you can experiment some weird connection/transaction issues.
I have not a perfect explanation, but I suspect a game of multiple transactions, imperfectly managed by SqlAlchemy - but not necessarily for bad reasons - to set some security limitations. Or something like that😂
No problem: here a tip to check if your queries worked, and otherwise, to restart them few times after a delay.
For UPDATE queries:
from sqlalchemy import create_engine, text
from sqlalchemy.orm import sessionmaker
from sqlalchemy.exc import OperationalError

myEngine = create_engine('mysql+mysqldb://%s:%s@%s:%i/%s' % (myUser, myPwd, myHost, myPort, myDb))
my_session = sessionmaker(bind=myEngine)
mySession = my_session()
mySession.begin()

def query_management_update(session, query, max_retries, retry_delay):
    attempts = 0
    while attempts < max_retries:
        try:
            session.execute(text(query))
            session.commit()
            print('OK, update executed on the first try.')
            attempts = max_retries

        except OperationalError as e:
            attempts += 1
            if attempts < max_retries:
                print(f'Connection issue, attempt {attempts}/{max_retries}. Retry in {retry_delay} seconds...')
                time.sleep(retry_delay)
            else:
                print('All attempts did not work!')
                raise e

myQuery = u'''UPDATE my_table SET my_field = REPLACE(my_field, 'xptdr', 'lol') WHERE my_field LIKE '%xptdr%' ;'''

query_management_update(mySession, myQuery, 5, 5)
For SELECT queries:
from sqlalchemy import create_engine, text
from sqlalchemy.orm import sessionmaker
from sqlalchemy.exc import OperationalError

myEngine = create_engine('mysql+mysqldb://%s:%s@%s:%i/%s' % (myUser, myPwd, myHost, myPort, myDb))

def query_management_select(query, max_retries, retry_delay):
    global myResult
    attempts = 0
    while attempts < max_retries:
        try:
            with myEngine.connect() as myConnexion:
                myResult = myConnexion.execute(text(query)).scalar()
                print('Select executed on the first try.')
                attempts = max_retries
        except OperationalError as e:
            attempts += 1
            if attempts < max_retries:
                print(f'Connection issue, attempt {attempts}/{max_retries}. Retry in {retry_delay} seconds...')
                time.sleep(retry_delay)
            else:
                print('All attempts did not work!')
                raise e

myQuery = '''SELECT TABLE_NAME FROM information_schema.TABLES WHERE table_schema = \'my_db\' AND TABLE_NAME = \'my_table\' ;'''

query_management_select(myQuery, 5, 5)
Execute a SELECT query with a timeout
To avoid your query if too slow (but it seems a non-finished thread does not stop at the continue, it will stop by itself just before):
import pandas as pd
import concurrent.futures
import psycopg2
from tabulate import tabulate

listId = [1,2,3,4,5,6,7,8,9,10]

myTimeOut = 60
def runMyQuery():
    try:
        with psycopg2.connect(database=xxx, user=xxxx, password=xxx, host=xxx, port='5432') as myCon:
            return pd.read_sql(myQuery, myCon)
    except:
        return None

for id in listId:

    myQuery = 'SELECT * FROM myTable WHERE id = ' + str(id)

    with concurrent.futures.ThreadPoolExecutor(max_workers=1) as executor:
        future = executor.submit(runMyQuery)

        try:
            myDf = future.result(timeout=myTimeOut)

            print(tabulate(myDf.head(10), headers='keys', tablefmt='psql', showindex=False))

        except concurrent.futures.TimeoutError:
            print('Over timeout of ' + str(myTimeOut))
            myDf = None
            continue
Execute UPDATE queries with a timeout
To avoid your query if too slow (but it seems a non-finished thread does not stop at the continue, it will stop by itself just before):
import pandas as pd
import concurrent.futures
import psycopg2
from tabulate import tabulate

listId = [1,2,3,4,5,6,7,8,9,10]

myTimeOut = 60
def runMyQueries():
    try:
        with psycopg2.connect(database=xxx, user=xxxx, password=xxx, host=xxx, port='5432') as myCon:
            with myCon.cursor() as cur:
                myQuery = '''
                    UPDATE myTable1 SET xxx = xxx ;
                    UPDATE myTable2 SET xxx = xxx ;
                    ...
                    '''
                cur.execute(requeteCreation)
                con66.commit()
        return print('OK...')
    except Exception as e:
        return print(e)

for id in listId:

    with concurrent.futures.ThreadPoolExecutor(max_workers=1) as executor:
        future = executor.submit(runMyQuery)

        try:
           goQueries = future.result(timeout=myTimeOut)

        except concurrent.futures.TimeoutError:
            print('Over timeout of ' + str(myTimeOut))
            continue
Merge, concatenate, append
Merge 2 lists in 2 columns and properly display them in the terminal
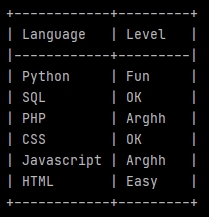
import pandas as pd
from tabulate import tabulate

LanguageList = ['Python', 'SQL', 'PHP', 'CSS', 'Javascript', 'HTML']
LevelList = ['Fun', 'OK', 'Arghh', 'OK', 'Arghh', 'Easy']

LanguageLevel = list(zip(LanguageList, LevelList))

df = pd.DataFrame(LanguageLevel, columns =['Language', 'Level'])

print(tabulate(df, headers='keys', tablefmt='psql', showindex=False))
The 7th line uses zip to link the values from our lists in tuples. list encloses our tuples in a list.
The 9th line creates a data-frame (pd.DataFrame) from our new list (now containing tuples). Specifying the column labels.
The print uses tabulate to display our fields with a beautiful Postgres style (psql).
Split a dataframe with conditions, and them merge the splits according other conditions
firstSelection = df.loc[df['Field'] == 'Yes'].head(100)

secondSelection = df.loc[df['Field'] == 'No'].head(200)

# Merge the 2 selections.
df_Selections = pd.concat([firstSelection, secondSelection], axis=0)
Concatenate dataframes in a loop
df_Concatenation = pd.DataFrame()

for ... :
    df...
    df_Concatenation = pd.concat([df_Concatenation, df], axis=0)
Aggregate files
Imagine that you want to iterate through a directory, which itself contains other directories, to aggregate Excel files contained in each of the subdirectories:
Context:
- The main directory is here named _ForAnalysis in C.
- The name of each subdirectories contains the word typical directory.
- The files that you would to aggregate are named Typical file.xlsx.
- Each Excel file contains a sheet named Typical sheet with a Field1 and a Field2.
Code:
from termcolor import colored
import os
import pandas as pd
from tabulate import tabulate

# workDirectory
workDirectory = 'C:/_ForAnalysis/'
print('\nWork directory: ' + workDirectory)

TypicalFile = 'Typical file.xlsx'
NumberTypicalFile = 0

df_CumulatedFiles = pd.DataFrame()

print(colored('\nCheck typical files (' + str(len(os.listdir(workDirectory))) + '):', 'blue'))

for rep in os.listdir(workDirectory):
    if 'typical directory' in rep:
        NumberTypicalFile += 1

        TypicalPath = os.path.join(workDirectory, rep)
        TypicalPath = TypicalPath + '/' + TypicalFile

        print(TypicalPath)

        df_TypicalFile = pd.read_excel(TypicalPath, sheet_name='Typical sheet', engine='openpyxl', usecols=['Field1', 'Field2'])

        # DISPLAY ONE BY ONE
        print(tabulate(df_TypicalFile.head(10), headers='keys', tablefmt='psql', showindex=False))
        print(str(df_TypicalFile.shape[0]), 'commune(s)')
        print('')

        # FILES CONCATENATION
        df_CumulatedFiles = pd.concat([df_CumulatedFiles, df_TypicalFile], axis=0)

print(colored('\n' + str(NumberTypicalFile) + ' file(s) have been aggregated:', 'blue'))
print(tabulate(df_CumulatedFiles.head(10), headers='keys', tablefmt='psql', showindex=False))
print(str(df_CumulatedFiles.shape[0]), 'lines')
Fill a dataframe from a list (append)
df = pd.DataFrame()

for l in MyList:
    dfTemp = pd.DataFrame({
        'Field 1': 'Georges',
        'Field 2': [l]
    })

df = pd.concat([df, dfTemp], axis=0)

print('\ndf :')
print(tabulate(df.head(2), headers='keys', tablefmt='psql', showindex=False))
print(df.shape[0])
Analyze data from a multi-valued field
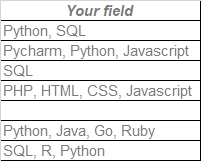 Suppose you have a field containing values coming from a multi-valued drop-down list. But now you want to count how many times each value exists.
If values were uniques in each cell, a simple GROUP BY in SQL would do the job.
But here we first have to split each cell to recover unique values, then we will be able to count them.
#Pandas
Split the data
Start splitting the data with str.split specifying the separator and expanding, to create new columns to store each unique values.
import pandas as pd

df = pd.read_excel('C:/Users/Georges/Downloads/My Excel file.xlsx',
                   sheet_name='Sheet1', engine='openpyxl')

serie = df['Your field'].str.split(', ', expand=True)

print(serie)
Or just for add splits to the current data:
df_Split = df.join(df['Your field'].str.split(', ', expand=True))
Great! Now we get virtual columns containing only one value, with as much columns as necessary.
Melt the virtual data
Now let's go to melt our virtual columns in just one.
import pandas as pd

df = pd.read_excel('C:/Users/Georges/Downloads/My Excel file.xlsx',
                   sheet_name='Sheet1', engine='openpyxl')

serieMelt = pd.melt(df['Your field'].str.split(', ',expand=True))['value']

print(serieMelt)
str.split gives virtual column labels named value, that we can use.
Count unique values
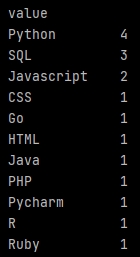
Now just put our melted data in a new data frame, before to apply a sorted groupby by size() (a COUNT in SQL).
 The full code will be:
import pandas as pd

df = pd.read_excel('C:/Users/Georges/Downloads/My Excel file.xlsx', sheet_name='Sheet1', engine='openpyxl')

temp_df = pd.DataFrame(pd.melt(df['Your field'].str.split(', ', expand=True))['value'])

df_Count = pd.DataFrame(temp_df.groupby(['value']).size(), columns=['Total']).reset_index()

print(df_Count)
We add a reset_index() to recover column names properly, to use them later.
Percentage
Ok, but suppose you want also the recurrence percentages of your unique values. The usual method will take the total from the melted data, giving strange results. Indeed the melted data cumulated each values from the multi-valued field in new rows, so a lot!
To get real percentages you have to use shape[0] to count the real number of rows from your original data-frame, and use it in the percentage calculation.
We start creating a new field in the results data-frame, then we calculate percentages, rounding them.
df_Count['Percent'] = (df_Count['Total'] / df.shape[0]) * 100
df_Count['Percent'] =df_Count['Percent'].round(decimals=2)
Of course, you can not add the percentage results, it will exceed 100% and it is normal.
Empty values management
Good. But about our empty values? Just add dropna=False to see them.
import pandas as pd

df = pd.read_excel('C:/Users/Georges/Downloads/My Excel file.xlsx', sheet_name='Sheet1', engine='openpyxl')

temp_df = pd.DataFrame(pd.melt(df['Your field'].str.split(', ', expand=True))['value'])
df_Count = pd.DataFrame(temp_df.groupby(['value'], dropna=False).size(), columns=['Total']).reset_index()

df_Count['Percent'] = (df_Count['Total'] / df.shape[0]) * 100
df_Count['Percent'] =df_Count['Percent'].round(decimals=2)

print(df_Count)
Any problem?
Arrgg! The groupby counted empty values from the melted data, and the melted data has added new columns as many times as necessary (based on the record with the highest number of unique values). Each them containing empty values ... It skews the count and percentage.
We have to cheat to fix that.
The 7th line adds a specific value in the results data-frame to target the wrong empty values calculation (AZERTY).
The 12 and 13th count the empty values and its percentage aside, and store results in specific variables.
Then the 15th line replaces the empty values calculation with our new value and variables, using loc to identify the line to fix.
Finally we can sort our data-frame with sort_values(['Total'].
Work with dates
Get true date format from string data
Example, you have dates like 21/09/2022 but you would a true date format to work with it:
df['TrueDate'] = pd.to_datetime(df['OriginalDate'], infer_datetime_format=True).dt.strftime('%Y-%m-%d')
Group by months
If you have a data-frame df with a field Created at containing dates like:
2021-02-05 10:34:21 UTC
You can work with it, example to group and sort by month, you can cheat doing:
df_Temp = pd.DataFrame(df['Created at'].str[:7])
df_Created_count = pd.DataFrame(df_Temp.groupby(['Created at'], dropna=False).size(), columns=['Total']).sort_values(['Created at'], ascending=True).reset_index()
indeed with str[:7] we extract years and months from strings. Then a usual groupby.
Ok but it is more a pandas-way to convert your field in a true date format, in a new virtual field. Then you can extract real months and store them in a proper data-frame.
df['Created'] = pd.to_datetime(df['Created at'])
df['Created'] = df['Created'].dt.to_period("M")
df_TempCreated = pd.DataFrame(df['Created'])
Then easy to group and count them.
df_Created_count = pd.DataFrame(df_TempCreated.groupby(['Created'], dropna=False).size(), columns=['Total']).sort_values(['Created'], ascending=True).reset_index()
As now you use a real date format, you can display the full months with dt.strftime.
df_Created_count['Created'] = df_Created_count['Created'].dt.strftime('%B %Y')
Format date
If you get date like 2022-10-24 and you would 24/10/2022:
df['My date'] = pd.to_datetime(df['My date'], format='%Y-%m-%d')
df['My date'] = df['My date'].dt.strftime("%d/%m/%Y")
Format date from french format
If you get date like 11/05/2023 and you would 2023-05-11:
df['My date'] = df['French date'].str.split('/').str[2] + '-' + df['French date'].str.split('/').str[1] + '-' + df['French date'].str.split('/').str[0]
Get simple date (DDDDMMDD)
# SIMPLE DATE
df_DataUnion['date_simple'] = df_DataUnion['date_submit'].astype(str).str[:10]
df_DataUnion['date_simple'] = df_DataUnion['date_simple'].replace({'-': ''}, regex=True)
Extract the previous month
PreviousMonth = today - pd.DateOffset(months=1)
print(PreviousMonth.strftime("%Y-%m"))
Convert false date field from Excel
Excel can concatenate true date format and string in the same column, arrgh! Later when you would use it in Pandas...
I use this tip to manage these kind of malicious fields in pandas:
df.loc[~df_GDC['date'].str.contains(' ', na=False), 'date'] = df['date'].astype(str).str.split(expand=True)[0]
df.loc[~df_GDC['date'].str.contains(' ', na=False), 'date'] = \
    df['date'].astype(str).str.split('-', expand=True)[2] + '/' +\
    df['date'].astype(str).str.split('-', expand=True)[1] + '/' +\
    df['date'].astype(str).str.split('-', expand=True)[0]
Eventually I put the code above in a try:... except:...
Eventually I convert all my field in string before, with astype(str)
Manage numeric date from Excel
Sometimes dates from Excel come as integer, arrgghhh!
import xlrd

def read_date(date):
    return xlrd.xldate.xldate_as_datetime(date, 0)

df.loc[df['My date'].astype(str).str.isdigit() == True, 'My date'] = \
pd.to_datetime(df['My date'].loc[df['My date'].astype(str).str.isdigit()].astype(int).apply(read_date), errors='coerce')
Check date format
Sometimes (especilally when it comes from Excel...) it is good to check your dates after treatments.
Below we search dates not starting with DD/MM/YYYY:
df2 = df[~df['my date'].str.contains('^[0-9][0-9]/[0-9][0-9]/[0-9][0-9][0-9][0-9]', regex=True)]

print(tabulate(df2, headers='keys', tablefmt='psql', showindex=False))
Check if a date is in the future
There are many ways, but here converting in number:
from datetime import date, datetime

today = date.today()

df_ProblemeDate = df[['My date']][pd.to_numeric(df['My date'].str.split('/').str[2] + df['My date'].str.split('/').str[1] + df['My date'].str.split('/').str[0]) > int(str(today).replace('-', ''))]
Most recent date
mostRecentDate = df['Date'].max()
Most old date
mostOldDate = df['Date'].min()
Period between 2 dates
periodFromToday = today - mostOldDate
print(periodFromToday.days)
Count opening days with the same date column between the 2 following lines
Imagine each line of your dataframe is a delivery, with a Date field:
import pandas as pd
from tabulate import tabulate

import numpy as np
import datetime as dt

...
df['Year'] = df['Date'].str.split('/').str[2]
df['Month'] = df['Date'].str.split('/').str[1]
df['Day'] = df['Date'].str.split('/').str[0]

df['Opening days'] = ''

df.reset_index(drop=True, inplace=True)

for i, row in df.iterrows():
    dateDeliveryYear = int(row['Year'])
    dateDeliveryMonth = int(row['Month'])
    dateDeliveryDay = int(row['Day'])

    if i == 0:
        df.at[i, 'Opening days'] = 'First delivery'

    if i > 0:
        beforeDateDeliveryYear = int(df.iloc[[i-1]]['Year'].item())
        beforeDateDeliveryMonth = int(df.iloc[[i-1]]['Month'].item())
        beforeDateDeliveryDay = int(df.iloc[[i-1]]['Day'].item())

        start = dt.date(beforeDateDeliveryYear,beforeDateDeliveryMonth,beforeDateDeliveryDay)
        end = dt.date(dateDeliveryYear,dateDeliveryMonth,dateDeliveryDay)

        df.at[i, 'Opening days'] = np.busday_count(start, end)

print('\n' + u)
print(tabulate(df.head(10), headers='keys', tablefmt='psql', showindex=True))
print(df.shape[0])
Work with phones
phonenumbers library
If you have a phone field and a country code field:
...
import phonenumbers
...

df['Phone'] = df['Phone'].fillna('')
df['CountryCode'] = df['CountryCode'].fillna('')

df['TestPhone'] = df.apply(
    lambda x: phonenumbers.parse(str(x['Phone']), str(x['CountryCode']))
    if str(x['Phone']) != ''
    and str(x['CountryCode']) != ''
    else '',
    axis='columns'
)
Full phone fix
# FIX PHONE df['Phone'] = df['Phone'].str.strip() df['Phone'] = df['Phone'].replace({'-': ' '}, regex=True) df['Phone'] = df['Phone'].replace({'_': ' '}, regex=True) df['Phone'] = df['Phone'].replace({'\.': ' '}, regex=True) df['Phone'] = df['Phone'].replace({',': ' '}, regex=True) df['Phone'] = df['Phone'].replace({' ': ' '}, regex=True) df['Phone'] = df['Phone'].replace({'[a-zA-Z]': ''}, regex=True) df['Phone'] = df['Phone'].replace({' ': ' '}, regex=True) df['Phone'] = df['Phone'].replace({'^ ': ''}, regex=True) df['Phone'] = df['Phone'].replace({'\*': ''}, regex=True) df['Phone'] = df['Phone'].replace({'\(': ''}, regex=True) df['Phone'] = df['Phone'].replace({'\)': ''}, regex=True) df['Phone'] = df['Phone'].replace({'\$': ''}, regex=True) df['Phone'] = df['Phone'].str.strip() df['Phone'] = df['Phone'].fillna('') df.loc[df['Phone'].str.replace(' ', '').str.len() < 4, 'Phone'] = '' df['CountryCode'] = df['CountryCode'].fillna('') # CREATE TESTPHONE FIELD df['TestPhone'] = '' df = df.reset_index(drop=True) for i, row in df.iterrows(): myPhone = row['Phone'] myCountryCode = row['CountryCode'] MyTest = '' try: # IF PHONE EXISTS AND START WITH "+" AND COUNTRY EXISTS if myPhone != '' and myPhone.startswith('+') and myCountryCode != '': MyTest = phonenumbers.parse(myPhone, myCountryCode) # IF PHONE EXISTS AND NOT START WITH "+" AND COUNTRY EXISTS if myPhone != '' and not myPhone.startswith('+') and myCountryCode != '': MyTest = phonenumbers.parse(myPhone, myCountryCode) # IF PHONE EXISTS AND START WITH "+" AND COUNTRY NOT EXISTS if myPhone != '' and myPhone.startswith('+') and myCountryCode == '': MyTest = phonenumbers.parse(myPhone, myCountryCode) # IF PHONE EXISTS AND NOT START WITH "+" AND COUNTRY NOT EXISTS if myPhone != '' and not myPhone.startswith('+') and myCountryCode == '': MyTest = phonenumbers.parse('+' + myPhone, myCountryCode) except: pass df.at[i,'TestPhone'] = MyTest df['AutoCode'] = '' df.loc[df['TestPhone'] != '', 'AutoCode'] = '+' + df['TestPhone'].astype(str).replace({'Country Code: ': ''}, regex=True).replace({'( National Number: ).*': ''}, regex=True) df['AutoNationalPhone'] = '' df.loc[df['TestPhone'] != '', 'AutoNationalPhone'] = df['TestPhone'].astype(str).replace({'^.*? National Number: ': ''}, regex=True).astype(str).replace({'( Leading Zero).*': ''}, regex=True) # CONCATENATION df['Formatted Phone'] = df[['AutoCode', 'AutoNationalPhone']].apply(lambda x: ' '.join(x.dropna()), axis=1).fillna('') df.loc[~df['Formatted Phone'].str.startswith(('+')), 'Formatted Phone'] = df['Phone'] # AUTOCOUNTRYCODE df['AutoCountryCode'] = '' df = df.reset_index(drop=True) for i, row in df.iterrows(): myCountryCode = row['CountryCode'] MyTest = '' try: MyTest = phonenumbers.country_code_for_region(myCountryCode) except: pass df.at[i,'AutoCountryCode'] = MyTest # LAST df.loc[(~df['Formatted Phone'].str.startswith(('+'))) & (df['AutoCountryCode'] != 0) & (df['Phone'] != ''), 'Formatted Phone'] = '+' + df['AutoCountryCode'].astype(str) + ' ' + df['Phone'].replace({'^0': ''}, regex=True) # IS_POSSIBLE_NUMBER df['is_possible_number'] = '' for i, row in df.iterrows(): myPhone = row['Formatted Phone'] MyTest = '' try: MyTest = phonenumbers.is_possible_number(phonenumbers.parse(myPhone, None)) except: pass df.at[i, 'is_possible_number'] = MyTest # IS_VALID_NUMBER df['is_valid_number'] = '' for i, row in df.iterrows(): myPhone = row['Formatted Phone'] MyTest = '' try: MyTest = phonenumbers.is_valid_number(phonenumbers.parse(myPhone, None)) except: pass df.at[i, 'is_valid_number'] = MyTest # DELETE WRONG NUMBER df.loc[(df['is_valid_number'] == False) & (df['is_possible_number'] == False), 'Formatted Phone'] = '' # RE-ORDER df = df[['Phone', 'CountryCode', 'Formatted Phone']] print(tabulate(df.head(30), headers='keys', tablefmt='psql', showindex=False))
Pie Chart
Simple pie
If you have a data-frame with fields Categories and Total, you can create a pie chart.
import matplotlib.pyplot as plt

chartLabel = df_Categories_count['Categories'].tolist()
chartValue = df_Categories_count['Total'].tolist()

colors = plt.rcParams['axes.prop_cycle'].by_key()['color']

fig1 = plt.figure()
plt.pie(chartValue, labels=chartLabel, colors=colors, autopct=None, shadow=False, startangle=90)
plt.axis('equal')
plt.title('Categories', pad=20, fontsize=15)

plt.show()
plt.clf()
Display percentages in the chart
Use autopct.
plt.pie(chartValue, labels=chartLabel, colors=colors, autopct='%1.1f%%', shadow=False, startangle=90)
Change the labels font size
plt.rcParams['font.size'] = 5
Hide a label in chart
Just replace the value with an empty string.
chartLabel[-1] = ''
Add a legend in your chart
plt.legend(chartLabel, loc='best', fontsize=8)
Explode
To explode your chart, you need to pass values in explode, example if you have 4 values to plot:
plt.pie(myValue, labels=myLabels, colors=colors, explode=[0.05, 0.05, 0.05, 0.05], autopct=None, shadow=False, startangle=90)
If you want explode all part by default, just create a list before:
explodeValues = []
for i in myValue:
    explodeValues.append(0.05)

plt.pie(myValue, labels=myLabels, colors=colors, explode=explodeValues, autopct=None, shadow=False, startangle=90)
Add a legend with several fields
For example you want display labels and percentages in the legend. First calculate percentages in another field in your data-frame, then:
import matplotlib.pyplot as plt

chartLabel = df_Categories_count['Categories'].tolist()
chartLegendLabel = df_Categories_count['Categories'].tolist()
chartValue = df_Categories_count['Total'].tolist()
chartLegendPercent = df_Categories_count['Percent'].tolist()

legendLabels = []
for i, j in zip(chartLegendLabel, map(str, chartLegendPercent)):
    legendLabels.append(i + ' (' + j + ' %)')

colors = plt.rcParams['axes.prop_cycle'].by_key()['color']

fig1 = plt.figure()
plt.pie(chartValue, labels=chartLabel, colors=colors, autopct=None, shadow=False, startangle=90)
plt.axis('equal')

plt.title('Categories', pad=20, fontsize=15)
plt.legend(legendLabels, loc='best', fontsize=8)

plt.show()
plt.clf()
Display only first labels around the plot
...
# Display only first indices in legend
def autopct_masque(index_mask):
    def format_pct(pct, allvals):
        index = format_pct.index
        format_pct.index += 1
        if index in index_mask:
            return '' # Masquer ce pourcentage
        return f'{pct:.1f}%'
    format_pct.index = 0
    return lambda pct: format_pct(pct, chartLegendPercent)

...

# Create plot
# Sort a DF previously calculating percentage
df_sorted = myDf.sort_values(by='Pourcentage', ascending=False).reset_index(drop=True)

chartLabel = df_sorted['fieldPreviouslyGroupedForPercentage'].tolist()
chartLegendLabel = df_sorted['fieldPreviouslyGroupedForPercentage'].tolist()
chartValue = df_sorted['Total'].tolist()
chartLegendPercent = df_sorted['Pourcentage'].tolist()

# Display only first indices
displayOnlyFirst = 4
calculHowManyToHide = len(chartLegendPercent) - displayOnlyFirst
hiddenIndices = list(range(len(chartLegendPercent) - calculHowManyToHide, len(chartLegendPercent)))

# Hide last indices
for i in hiddenIndices:
    chartLabel[i] = ''

explodeValues = [0.05] * len(chartValue)

legendLabels = []
for i, j in zip(chartLegendLabel, map(str, chartLegendPercent)):
    legendLabels.append(i + ' (' + j + ' %)')

# Colors
colors = plt.rcParams['axes.prop_cycle'].by_key()['color']

myFig = plt.figure()

# Get objects to hide indices and format plot
wedges, texts, autotexts = plt.pie(
    chartValue,
    labels=chartLabel,
    colors=colors,
    explode=explodeValues,
    autopct=autopct_masque(hiddenIndices),
    shadow=False,
    startangle=90,
    labeldistance=1
)

...
Customize text labels around the plot
# Customize labels around the plot
wordToDelete = 'Specialty'

for text in texts:
    ancien_texte = text.get_text()
    nouveau_texte = ancien_texte.replace(wordToDelete, '').strip()
    text.set_text(nouveau_texte)

for i, text in enumerate(texts):
    label = chartLabel[i]
    if label == 'Value1... blablabla':
        # text.set_color('blue')
        text.set_fontsize(9)
        # text.set_fontweight('bold')
        text.set_text('Value1\nblablabla')

    elif label == 'Value2... blablabla':
        text.set_text('Value2\nblablabla\nblablabla')
        text.set_fontsize(9)

    elif label == 'Value3... blablabla':
        text.set_text('Value3\nblablabla\nblablabla')
        text.set_fontsize(9)

    else:
        text.set_fontsize(9)

# Reduce percentage size font
for autotext in autotexts:
    autotext.set_fontsize(8)

plt.axis('equal')
plt.title('EDS Terminale 2', pad=20, fontsize=15)

myFig.savefig(downloadsDir+'myPlot.png', dpi=100)
plt.clf()

im = Image.open(downloadsDir+'myPlot.png')
bordered = ImageOps.expand(im, border=1, fill=(0, 0, 0))
bordered.save(downloadsDir+'myPlot.png')

# Insert in Excel
img = openpyxl.drawing.image.Image(downloadsDir+'myPlot.png')
img.anchor = 'E4'

workbook['An Excel tab'].add_image(img)
workbook.save(statsFile)

...

os.remove(downloadsDir + 'myPlot.png')
Bar chart
Vertical bar chart
chartLabel = df_Created_count['Labels field'].tolist()
chartValue = df_Created_count['Values field'].tolist()

fig5 = plt.figure(figsize=(13,6))
bar_plot = plt.bar(chartLabel, chartValue)

# plt.ylabel('yyy')
# plt.xlabel('xxx')
plt.xticks(rotation=30, ha='right')

# HIDE BORDERS
plt.gca().spines['left'].set_color('none')
plt.gca().spines['right'].set_color('none')
plt.gca().spines['top'].set_color('none')

# HIDE TICKS
plt.tick_params(axis='y', labelsize=0, length=0)
plt.yticks([])

# ADD VALUE ON THE END OF HORIZONTAL BARS
# for index, value in enumerate(chartValue):
#     plt.text(value, index, str(value))

# ADD VALUE ON THE TOP OF VERTICAL BARS
def autolabel(rects):
    for idx, rect in enumerate(bar_plot):
        height = rect.get_height()
        plt.text(rect.get_x() + rect.get_width()/2, height, chartValue[idx], ha='center', va='bottom', rotation=0)

autolabel(bar_plot)

plt.title('Registrations by month', pad=20, fontsize=15)

plt.show()
plt.clf()
Work with shapefiles (without Geopandas)
Here we will use numpy and basemap.
pip install numpy
pip install basemap
To install basemap on WIndows, download a package here, according your versions, and install it with wheel.
Thanks to ramiro.org. I got the code below on his website, I just adapted it.
Suppose you have an Excel file with a country field, you get count and map them with a country shape. The country names in the Excel file and in the shape must be the same.
Zoom on France
map1.suptitle('Académies', fontsize=20, y=.87)

m = Basemap(projection='merc', resolution='l', \
llcrnrlon=-7, # Longitude minimale : étend vers l'est \
llcrnrlat=39.5, # Latitude minimale : étend vers le sud \
urcrnrlon=13, # Longitude maximale : étend vers l'ouest \
urcrnrlat=52) # Latitude maximale : étend vers le nord
Add labels or POI
ax.text(0.05, # Vers la droite
0.59, # Vers le haut
'Guadeloupe', fontsize=10, ha='center', transform=ax.transAxes)
Another example
If you use the shape attached named France-Departements-Deformation.shp:
############## Carte df_DepEtablissement
# Set academies as index
df_DepEtablissement.set_index('nom_departement_etablissement', inplace=True)
my_values = df_DepEtablissement['Pourcentage']
num_colors = 30
cm = plt.get_cmap('Blues')
scheme = [cm(i / num_colors) for i in range(num_colors)]
my_range = np.linspace(my_values.min(), my_values.max(), num_colors)

# -1 TO AVOID SEARCHS IN A PANDAS DATA-FRAME INCLUDING START AND STOP VALUE (I think ...)
df_DepEtablissement['Pourcentage'] = np.digitize(my_values, my_range) - 1

map2 = plt.figure(figsize=(14, 10))
ax = map2.add_subplot(111, frame_on=False)

map2.suptitle('Départements', fontsize=20, y=.87)

m = Basemap(projection='merc', resolution='l',
llcrnrlon=-9, \ # Longitude minimale : étend vers l'est
llcrnrlat=39.5, \ # Latitude minimale : étend vers le sud
urcrnrlon=15, \ # Longitude maximale : étend vers l'ouest
urcrnrlat=52) \ # Latitude maximale : étend vers le nord

m.drawmapboundary(color='w')

m.readshapefile(shp_departements, 'units', color='#444444', linewidth=.2, default_encoding='utf-8')

# Create the chloro map
for info, shape in zip(m.units_info, m.units):
    shp_departements = info['dep_name']
    if shp_departements not in df_DepEtablissement.index:
        color = '#dddddd'
    else:
        color = scheme[df_DepEtablissement.loc[shp_departements]['Pourcentage']]
    # patches = [Polygon(np.array(shape), True)]
    patches = [Polygon(np.array(shape))]
    pc = PatchCollection(patches)
    pc.set_facecolor(color)
    ax.add_collection(pc)

# Cover up Antarctica so legend can be placed over it
# ax.axhspan(0, 1000 * 1800, facecolor='w', edgecolor='w', zorder=2)

# Draw color legend
ax_legend = map2.add_axes([0.2, 0.14, 0.6, 0.03], zorder=3)
cmap = mpl.colors.ListedColormap(scheme)

# cb = mpl.colorbar.ColorbarBase(ax_legend, cmap=cmap, ticks=my_range, boundaries=my_range, orientation='horizontal')
# cb.ax.set_xticklabels([str(round(i, 1)) for i in my_range])
# cb.ax.tick_params(labelsize=7)
# cb.set_label('Pourcentage', rotation=0)
# cb.remove()

# Créer une barre de couleur pour la légende
# Définir les labels des pays sur l'axe des x
norm = mpl.colors.Normalize(vmin=min(my_range), vmax=max(my_range))
cbar = plt.colorbar(mpl.cm.ScalarMappable(cmap=cmap, norm=norm), ax_legend, ticks=my_range, boundaries=my_range, orientation='horizontal')
cbar.ax.set_xticklabels([str(round(i, 1)) for i in my_range])
cbar.ax.tick_params(labelsize=7)
cbar.set_label('PourcentageX', rotation=0)

ax.text(0.125, 0.565,'Guadeloupe', fontsize=10, ha='center', transform=ax.transAxes)

ax.text(0.175, 0.46, 'Martinique', fontsize=10, ha='center', transform=ax.transAxes)

ax.text(0.1, 0.18, 'Guyane', fontsize=10, ha='center', transform=ax.transAxes)

ax.text(0.42, 0.155, 'Mayotte', fontsize=10, ha='center', transform=ax.transAxes)

ax.text(0.6, 0.155, 'La Réunion', fontsize=10, ha='center', transform=ax.transAxes)

ax.text(0.73, 0.15, 'Corse', fontsize=10, ha='center', transform=ax.transAxes)

ax.text(0.83, 0.41, 'Nouvelle-Calédonie', fontsize=10, ha='center', transform=ax.transAxes)

ax.text(0.8, 0.515, 'Polynésie Française', fontsize=10, ha='center', transform=ax.transAxes)

ax.text(0.836, 0.69, 'Inconnu', fontsize=8, ha='center', transform=ax.transAxes)

ax.text(0.86, 0.903, 'Étranger', fontsize=8, ha='center', transform=ax.transAxes)

map2.savefig(downloadsDir + 'mymap2.png', dpi=80, bbox_inches='tight')

# plt.show()
# plt.clf()

im = Image.open(downloadsDir + 'mymap2.png')
bordered = ImageOps.expand(im, border=1, fill=(0, 0, 0))
bordered.save(downloadsDir + 'mymap2.png')

# INSERT IN EXCEL
img = openpyxl.drawing.image.Image(downloadsDir+'mymap2.png')
img.anchor = 'E4'
workbook['Départements établissements'].add_image(img)
workbook.save(statsFile)

################# REMOVE PICTURES
os.remove(downloadsDir + 'mymap2.png')
Geopandas
Geodataframe from a shape
import geopandas as gpd
from tabulate import tabulate

myShape = 'C:\\Path\\Of\\My\\Shape.shp'

print('\n' + myShape)

df = gpd.read_file(myShape, encoding='iso-8859-1')
df['type'] = df['geometry'].astype(str).str.replace(r' .*|\(.*', '', regex=True)
df = df[['id', 'type', 'geometry']]

print(tabulate(df.head(10), headers='keys', tablefmt='psql', showindex=True))
print(df.shape[0])

MyFieldList = df['id'].drop_duplicates().dropna().sort_values(ascending=False).tolist()
print('\n' + str(MyFieldList))

MyGeomTypeList = df['type'].drop_duplicates().dropna().sort_values(ascending=False).tolist()
print('\n' + str(MyGeomTypeList))
Geodataframe from a dataframe using WKT
First, read a dataframe with WKT data in field name wkt for example. Then:
import geopandas as gpd
from shapely import wkt

...

df['geometry'] = gpd.GeoSeries.from_wkt(df['wkt'])

geo_df = gpd.GeoDataFrame(df, geometry='geometry')
geo_df.drop('wkt', axis=1, inplace=True)

...
Add CRS/projection
df = df.set_crs('epsg:4326')
Convert CRS/projection
df = df.to_crs(2154)
Display a map
from tabulate import tabulate
import matplotlib.pyplot as plt

MyLayer = 'E:\\Path\\to\\shape.shp'
df = gpd.read_file(MyLayer)

df.plot()
plt.title('My layer', pad=10, fontsize=10)
plt.show()
Display several geodataframes in one map
fig, ax = plt.subplots()

# POLYGONS
df1.plot(
ax=ax,
color='#90EE90',
edgecolor='black',
zorder=2
)

# POLYGONS
df2.plot(
ax=ax,
color='#FF7F7F',
edgecolor='black',
zorder=1
)

# POINTS
dfPoints.plot(
ax=ax,
facecolor='red',
edgecolor='black',
zorder=3
)

# LINES
dfLine.plot(
ax=ax,
edgecolor='purple',
linewidth=10,
zorder=3
)


plt.title('My map', pad=10, fontsize=10)
plt.show()
Zoom on a layer from a subplot
...
# Extract extent from your GDF
MinX, MinY, MaxX, MaxY = gdf.geometry.total_bounds
print('MinX :', MinX)
print('MinY :', MinY)
print('MaxX :', MaxX)
print('MaxY :', MaxY)
...
# Zoom
ax.set_xlim(cibleMinX - 1, cibleMaxX + 1)
ax.set_ylim(cibleMinY - 1, cibleMaxY + 1)
...
Display the Coordinate Reference Systems (CRS)
print('Proj : ' + str(df.crs))
Check geometry
df['valid ?'] = df.is_valid
df = df[df['valid ?'] == False]

print(tabulate(df.head(5), headers='keys', tablefmt='psql', showindex=False))
print(df.shape[0])
Check projection
if str(df.crs) == 'epsg:2154':
    print(colored('OK: ' + str(df.crs), 'green'))
if str(df.crs) != 'epsg:2154':
    print(colored('Warning: ' + str(df.crs), 'red'))
Extract vertices (all vertex/point) from polygon
Use extract_unique_points() to extract as MultiPoints:
dfMultiPoints = df.copy()
dfMultiPoints['geometry'] = dfMultiPoints['geometry'].extract_unique_points()
Count single geometry
df['Number'] = df['geometry'].apply(lambda geom: len(geom.geoms))
Simplify polygon
import topojson as tp

topo = tp.Topology(df, prequantize=False)

dfSimple = topo.toposimplify(5).to_gdf()

print(tabulate(dfSimple, headers='keys', tablefmt='psql', showindex=False))
Extract segments from polygon
from shapely.geometry import LineString

myPolygon = myGdf.geometry.iloc[0]
pointsCoords = list(myPolygon.exterior.coords)
segments = [LineString([pointsCoords[i], pointsCoords[i + 1]]) for i in range(len(pointsCoords) - 1)]

dfSegments = gpd.GeoDataFrame(geometry=segments, crs=myGdf.crs)

print(tabulate(dfSegments, headers='keys', tablefmt='psql', showindex=True))
Calculate intersection lines on polygons
def calculate_intersection_ratio(line, polygons_union):
    intersection = line.intersection(polygons_union)
    total_length = line.length
    intersected_length = intersection.length if not intersection.is_empty else 0
    return (intersected_length / total_length) * 100 if total_length > 0 else 0

polygons_union = dfPolygons.geometry.unary_union

dfLines['intersection'] = dfLines.geometry.apply(
    lambda line: calculate_intersection_ratio(line, polygons_union)
)

dfLines = dfLines[['Seg Id', 'intersection', 'geometry']]

print(tabulate(dfLines, headers='keys', tablefmt='psql', showindex=False))
Calculate line length
if df.crs.is_projected:
    print(colored('\nOK, the projection is in projected meters!', 'green'))
    df['longueur'] = df.geometry.length
Calculate area/total area
if df.crs.is_projected:
    print(colored('\nOK, the projection is in projected meters!', 'green'))
    df['area'] = df.geometry.area

surface_totale = df.geometry.area.sum()
print(colored('\nSurface totale : ' + str(surface_totale), 'green'))
Export a dataframe with WKT geometries as a Geopackage
import geopandas as gpd
from shapely import wkt

myGpkg = 'C://Users//my file.gpkg'

if os.path.exists(myGpkg) == True:
    os.remove(myGpkg)

myDf['geometry'] = myDf['wkt'].apply(wkt.loads)
myDf.drop('wkt', axis=1, inplace=True)

gdf = gpd.GeoDataFrame(myDf, geometry='geometry', crs='EPSG:4326')
gdf.to_file(myGpkg, driver='GPKG', layer='A layer')
But sometimes, with some old Python versions I have stupid errors, so:
...
from contextlib import redirect_stderr
from io import StringIO
...
f = StringIO()
with redirect_stderr(f):
    gdf.to_file(myGpkg, driver='GPKG', layer='A layer')
Export a shape from Postgres
First, better to add it in Pandas/Geopandas as a WKT, in SQL:
...ST_ASTEXT(geom)...
Then:
...
import geopandas as gpd
from shapely import wkt
...
myShape = RepertoireCourant + 'myShape.shp'
df['geom'] = df['geom'].apply(wkt.loads)
geoExport = gpd.GeoDataFrame(df, geometry='geom', crs='EPSG:2154')
geoExport.to_file(myShape, driver='ESRI Shapefile')
...
Export a shape converting projection
Just add a to_crs just after the crs declaration:
...
import geopandas as gpd
from shapely import wkt
...
myShape = RepertoireCourant + 'myShape.shp'
df['geom'] = df['geom'].apply(wkt.loads)
geoExport = gpd.GeoDataFrame(df, geometry='geom', crs='EPSG:4326')
geoExport = geoExport.to_crs(epsg=2154)
geoExport.to_file(myShape, driver='ESRI Shapefile')
...
Export a shape defining field type
Use schema and 19 for a double in a dbf file:
structure = {
    'geometry': 'LineString',
    'properties': {
        'name': 'str:14',
        'id': 'int',
        'my_number': 'float:19.0',
        'my_decimal_number': 'float:19.0'
    },
}
geoDf.to_file(myFile, driver='ESRI Shapefile', schema=structure)
Create an empty shape
import geopandas as gpd

myShape = 'C:\\Path\\beautiful shape.shp'
schema = {"geometry": "Polygon", "properties": {"myid": "int"}}
crs = "EPSG:2154"
dfEmpty = gpd.GeoDataFrame(geometry=[])
dfEmpty.to_file(myShape, driver='ESRI Shapefile', schema=schema, crs=crs)
Save a map
import matplotlib.pyplot as plt
from PIL import Image, ImageOps

imagePath = myDirectory + '_Carte.png'
plt.savefig(imageChemin, dpi=250)
im = Image.open(imagePath)
bordered = ImageOps.expand(im, border=1, fill=(0, 0, 0))
bordered.save(imagePath)
# im.show()
Hide the axes graduations
ax.xaxis.set_ticks([])
ax.xaxis.set_ticklabels([])

ax.yaxis.set_ticks([])
ax.yaxis.set_ticklabels([])
Build a work environment
You are processing geometries in a loop. You want to display sample maps of 6 randomly processed geometries simultaneously.
Start by exporting your maps as an image, and save the paths to your images in a list.
...
imagesTemplate = []
...
imagesTemplate.append(imagePath)
...
Then:
...
from PIL import Image, ImageOps, ImageTk
from tkinter import Tk, Toplevel, Label, PhotoImage
...
# Settings for arranging windows
screen_width = 1920 # Screen width
screen_height = 1020 # Screen height

columns = 3
rows = 2

#Size windows to fit on screen
window_width = screen_width // columns

# Adjust
adjustment_factor = 0.905 # Réduire la hauteur des fenêtres de la première ligne
window_height_first_line = int((screen_height // rows) * adjustment_factor) # For 1st line
window_height_rest = screen_height // rows # For 2nd line

root = Tk()
root.withdraw() # Cache la fenêtre principale de tkinter

# Function to display an image in a tkinter window
def open_image(path, x, y, height):
    top = Toplevel()
    top.geometry(f"{window_width}x{height}+{x}+{y}")
    top.title(path)

    img = Image.open(path)
    img = img.resize((window_width, height), Image.LANCZOS)
    img_tk = ImageTk.PhotoImage(img)

    label = Label(top, image=img_tk)
    label.image = img_tk
    label.pack()

for index, image_path in enumerate(imagesTemplate[0:6]):
    col = index % columns
    row = index // columns
    x = (col * window_width)-8

    if row == 0: # 1st line
        y = row * window_height_first_line
        height = window_height_first_line

    else: # 2nd line
        y = row * window_height_rest
        y -= 18
        height = window_height_rest

    open_image(image_path, x, y, height)

root.mainloop()
Or with 2 axes (a map to the left, and some data/text to the right):
fig, ax = plt.subplots(1, 2, gridspec_kw={'width_ratios': [2, 1]})

ax[0].set_aspect('equal')
ax[0].set_title('Blablbla' + str(idParcelle) + ' (ID ' + str(id) + ')', pad=10, fontsize=10, weight='bold')

dfCible.plot(
ax=ax[0],
color='#0088CC',
edgecolor='black',
zorder=2
)

ax[1].axis('off')
ax[1].set_title('Blablabla Xxxx', pad=10, fontsize=10, weight='bold')
Joins
SQL JOIN LEFT
df_Join = pd.merge(df1, df2, left_on='Email', right_on='email', how='left')[['Email', 'source']]
Another example:
df_Merged = df1.merge(df2, on='id', how='left')
Another example to find the non-matching records on 2 fields:
df_join = pd.merge(df1, df2, left_on=['id1', 'field1'], right_on=['id2', 'field2'], how='left')[['id1', 'field1', 'field2']]
df_NoMatch = df_join[df_join['field2'].isna()]
SQL INNER JOIN
df_Join = pd.merge(df1, df2, on='Email')
Or:
df_Merged = df1.merge(df2, on='id', how='inner')
Find difference
df_difference = pd.DataFrame(df_First[~df_First['Email'].isin(df_Second['email'])])
Group, count and sort
List unique values
print(df_Deduped.field1.unique())
Count rows
To count all rows in a dataframe:
number = df.shape[0]
print(number)
Or just some rows from a filter:
nbrFilter = df.query('MyField == 1').shape[0]
print('nbrFilter:', nbrFilter )
Count values (group by)
If you have a field named Country in a data-frame named df:
CountCountry = df.groupby(['Country'], dropna=False).size().sort_values(ascending=False)
print(CountCountry)
Count values (group by) and get it in a dataframe (old way)
CountCommune = pd.DataFrame(df.groupby(['id_commune'], dropna=False).size(), columns=['Total']).sort_values(['Total'], ascending=False).reset_index()

print(tabulate(CountCommune.head(10), headers='keys', tablefmt='psql', showindex=False))
Better to that:
dfCount = (df.groupby(['myField'], dropna=False).agg(Total=('Type général', 'size')).sort_values('Total', ascending=False).reset_index())
Count values grouping by several fields to find duplicates
df_Duplicates = pd.DataFrame(df.groupby(['id_commune', 'PAGES'], dropna=False).size(), columns=['Total'])\
.sort_values(['Total'], ascending=False).reset_index()
df_Duplicates = df_Duplicates[(df_Duplicates['Total'] > 1)]

print(tabulate(df_Duplicates.head(10), headers='keys', tablefmt='psql', showindex=False))
Group concat
The field to concat (here below city) have to be as text (so maybe do a little .astype(str) juste before).
df = df.groupby(['country'])['city'].apply(lambda x: ', '.join(x)).reset_index()
And to sort your field, just do a little sorted(x) in the lambda function.
Count a specific value
print (len(df[df['Your field'] == 'United States']))
Count with condition
myCount = df[df['Field where search the condition'] == 'A value'].count()['Field to count']
Count empty values
number = df['Your field'].isna().sum()
Keep empty values in a group by and fill them
newDf = pd.DataFrame(df.groupby(['Your field'], dropna=False).size(), columns=['Total']).sort_values(['Total'], ascending=False).reset_index()
newDf = newDf.fillna('Unknow')
Count email domains (group by)
You have a Email field with clean emails. Thanks to Pandas it is easy to group and count their DNS.
First create a virtual field to split the emails and recover the 2nd part of the split. Then just group your new field.
df['Domain'] = df['Email'].str.split(<a href="mailto:'@').str">'@').str</a>[1]
df_Email_DNS_count = pd.DataFrame(df.groupby(['Domain']).size(), columns=['Total'])\
    .sort_values(['Total'], ascending=False).reset_index()
Count the recurrence of a character in a field
df['my_count'] = df['my_field'].str.count(';')Calculate percentages
Acording your needs, you can use the sum from a Total field.
df['Percent'] = (df['Total'] / df['Total'].sum()) * 100
df['Percent'] = df['Percent'].round(decimals=2)
Or the number of rows in your data-frame (useful if you work with a multi-valued field, see above the Analyze data from a multi-valued field chapter) .
df['Percent'] = (df['Total'] / df.shape[0]) * 100
df['Percent'] = df['Percent'].round(decimals=2)
Sum group by year
df['Year'] = df['DateInvoice'].dt.to_period('Y')

df_AmountYear = df.groupby(['Year'], dropna=False)['AmountEuro'].sum().reset_index()
df_AmountYear = df_AmountYear.sort_values(['Year'], ascending=False)

print('\nAmount per year:')
print(tabulate(df_AmountYear, headers='keys', tablefmt='psql', showindex=False))
Sort on a field
df.sort_values(by=['Field'], ascending=False, inplace=True)
# Recreate the index if necessary (if you will use the index later)
df = df.reset_index(drop=True)
Sort on a field containing both text and numerical values
df = df.loc[pd.to_numeric(df['My field'], errors='coerce').sort_values().index]
Sum and count
If you want sum an Amount field per country counting the number of lines:
df_AmountCountries = df.groupby(['Country'], dropna=False)\
    .agg({'ID': 'count', 'AmountEuro': 'sum'})\
    .reset_index()\
    .rename(columns={'ID': 'Number'})
Replace, remove, edit with conditions
Replace empty cells
df['speciality'] = df['speciality'].fillna('Other')
But sometimes you have infinite values (non-finite values) so better:
import numpy as np
...
df['speciality'] = df['speciality'].replace([np.inf, -np.inf, np.nan], 'Other')
Replace a value (the full value)
df['Your field'] = df['Your field'].replace(['Old value'],'New value')
Replace a part of a string using regex
df['Your field'] = df['Your field'].replace({'Old value': 'New value'}, regex=True)
Replace a part of a string using regex and ignoring the case
df['Your field'] = df['Your field'].replace({'OlD valUe': 'New value'}, regex=True, case=False)
Replace a string if it contains
df.loc[df['speciality'].str.contains('Researcher'), 'speciality'] = 'Research Scientist'
If not contains
Add ~:
df.loc[~df['speciality'].str.contains('Researcher'), 'speciality'] = 'Research Scientist'
Replace comma with point
df['myField'] = df['myField'].replace({'(?<=\d),(?=\d)': '.'}, regex=True)
Localize and remove rows
ind_drop = df[df['Your field'].apply(lambda x: x == ('A value'))].index
df = df.drop(ind_drop)
Localize and remove rows starting with ...
ind_drop = df[df['Your field'].apply(lambda x: x.startswith('A value'))].index
df = df.drop(ind_drop)
Localize and remove rows ending with ...
ind_drop = df[df['Your field'].apply(lambda x: x.endswith('A value'))].index
df = df.drop(ind_drop)
Localize and replace full rows
df.loc[(df['A field'] == 'TARGET')] = [[NewValue1, NewValue2, NewValue3]]
Localize rows according a regex and edit another field
df.loc[df['Field1'].str.contains(pat='^place ', regex=True), 'Field2'] = 'Yes'
Replace a field with values from another field with a condition
df['Field1'] = np.where(df['Field1']
    .apply(lambda x: x.startswith('A string in condition...')),
    df['Field2'], df['Field1'])
Remove some first characters
Here we delete the 2 first characters if the cell starts with a comma then a space.
df['Field'] = df['Field'].apply(lambda x: x[2:] if x.startswith(', ') else x)
Keep only some first characters
df['Field'] = df['Field'].apply(lambda x: x[:10])
Remove some last characters
df['DateInvoice'] = df['DateInvoice'].apply(lambda x: x[:-4] if x.endswith(' UTC') else x)
Remove the content from a field in another field
df['NewField'] = df.apply(lambda x : x['FieldToWork'].replace(str(x['FieldWithStringToRemove']), ''), axis=1)
Or with a regex, example to remove the content only if it is at the beginning of the field:
df['NewField'] = df.apply(lambda x : re.sub('^'+str(x['StringToRemove']), '', str(x['FieldToWork'])) if str(x['FieldToWork']).startswith(str(x['StringToRemove'])) else str(x['FieldToWork']), axis=1)
Edit with a condition
Increment a field if another field is empty.
df.loc[df['My field maybe empty'].notna(), 'Field to increment'] += 1
Fill a field if a field is greater or equal to another field.
df.loc[df['Field A'] >= df['Field B'], 'Field to fill'] = 'Yes'
Edit several fields in the same time.
df.loc[df['Field A'] >= df['Field B'], ['Field A to fill', 'Field B to fill']] = ['Yes', 'No']
Edit with several conditions
Condition "AND" (&)
df.loc[(df['My field maybe empty'].notna()) & (df['An integer field'] == 1) & (df['An string field'] != 'OK'), 'Field to increment'] += 1
Please replace "&" with a simple &.
Condition "OR" (|)
df.loc[(df['My field maybe empty'].notna()) | (df['An integer field'] == 1) | (df['An string field'] != 'OK'), 'Field to fill'] = 'Yes'
Edit with IN or NOT IN condition (as SQL)
Just use isin:
df.loc[df['Id field'].isin([531733,569732,652626]), 'Filed to edit'] = 'Yes'
And for NOT IN:
df.loc[df['Id field'].isin([531733,569732,652626]) == False, 'Filed to edit'] = 'No'
Replace values beginning with some text
df['id_commune'] = df['id_commune'].str.replace(r'(^75.*$)', '75056', regex=True)
Replace values from index indices
ind_fix = df2.index
df1.loc[ind_fix, 'MyField'] = 'XXX'
Not start with
~df[phone].str.startswith('A')Or:
~df[phone].str.startswith(('A', 'B'))Remove letters
df['mobile'] = df['mobile'].str.extract('(\d+)', expand=False).fillna('')
Extract before or after a string
Example if Job='IT: DBA'
df['type'] = df['Job'].str.split(': ').str[0]
df['speciality'] = df['Job'].str.split(': ').str[1]
Remove all after a string
df_Files['new field'] = df_Files['old field'].str.replace("(StringToRemoveWithAfterToo).*","", regex=True)
Remove all before a string
df_Files['file'] = df_Files['file'].str.replace("^.*?_","_", regex=True)
Get in title case
df['firstname'] = df['firstname'].str.title()
Remove if contains less of n character (lenght)
df.loc[df['mobile'].str.len() < 6, 'mobile'] = ''
Remove potential spaces before and after a string (trim)
Use .str.strip(), example:
df.loc[df['My field'].astype(str).str.isdigit() == False, 'My field'] = df['My field'].astype(str).str.strip()
Remove with a function (def)
def MyDeletion():

    # Eventually if your df does not exist when you create the function
    # global df

    ind_drop = df[df['My field'].apply(lambda x: x == ('My value'))].index
    df = df.drop(ind_drop)

...

MyDeletion()
Decode HTML special char
import html
df['My field'] = df['My field'].apply(lambda x: html.unescape(x))
Search by lines
Search some character getting column and row:
for row in df_ExportFeuil1.index:
    for col in df_ExportFeuil1.columns:
        cell_value = str(df_ExportFeuil1.at[row, col])
        if '\u2264' in cell_value:
            print(colored(f'Attention, signe inférieur ou égal à la ligne {row}, colonne {col} !', 'red'))
Or several very specific characters:
###################################### GESTION/VÉRIFICATION DES CHAMPS TEXTE
print(colored('\nVérification des caractères "très" spéciaux...', 'blue'))
timeNow = time.process_time()

# LES CARACTÈRES WINDOWS QUI GÊNE L'EXPORT AUTOMATIQUE POUR UNE RAISON D'ENCODAGE TRÈS SPÉCIALE
for col in df_ExportFeuil1.columns:
    if col in ChampsTexte:
        for row in df_ExportFeuil1.index:
            index = row + 4
            cell_value = str(df_ExportFeuil1.at[row, col])

            # Saut de ligne \r
            if '\r' in cell_value:
                print(colored(f'Attention, saut de ligne (\\r) à la ligne {index} notamment, colonne {col} !', 'red'))
                sys.exit()

            # Saut de ligne \n
            elif '\n' in cell_value:
                print(colored(f'Attention, saut de ligne (\\n) à la ligne {index} notamment, colonne {col} !', 'red'))
                sys.exit()

            # Tabulation
            elif '\t' in cell_value:
                print(colored(f'Attention, tabulation à la ligne {index} notamment, colonne {col} !', 'red'))
                sys.exit()

            # Espace fine
            elif '\u2009' in cell_value:
                print(colored(f'Attention, espace fine à la ligne {index} notamment, colonne {col} !', 'red'))
                sys.exit()

            # Supérieur ou égal
            elif '\u2265' in cell_value:
                print(colored(f'Attention, signe supérieur ou égal à la ligne {index} notamment, colonne {col} !', 'red'))
                sys.exit()

            # Inférieur ou égal ou égal
            elif '\u2264' in cell_value:
                print(colored(f'Attention, signe inférieur ou égal à la ligne {index} notamment, colonne {col} !', 'red'))
                sys.exit()

            # Delta
            elif '\u0394' in cell_value:
                print(colored(f'Attention, signe delta à la ligne {index} notamment, colonne {col} !', 'red'))
                sys.exit()

            # Tiret demi-cadratin
            elif '\u2013' in cell_value:
                print(colored(f'Attention, tiret demi-cadratin à la ligne {index} notamment, colonne {col} !', 'red'))
                sys.exit()

            # Caractère invalide
            elif '\ufffd' in cell_value:
                print(colored(f'Attention, caractère invalide à la ligne {index} notamment, colonne {col} !', 'red'))
                sys.exit()

            # Point d'interrogation
            elif '?' in cell_value:
                print(colored(f'Attention, Point d\'interrogation à la ligne {index} notamment, colonne {col}.', 'yellow'))
                sys.exit()

            # Point d'exclamation
            elif '!' in cell_value:
                print(colored(f'Attention, Point d\'exclamation à la ligne {index} notamment, colonne {col}.', 'yellow'))
                sys.exit()

            # Apostrophe spéciale
            elif '’' in cell_value:
                print(colored(f'Attention, Apostrophe spéciale à la ligne {index} notamment, colonne {col}.', 'yellow'))
                sys.exit()

            # Tiret spécial
            elif '‐' in cell_value:
                print(colored(f'Attention, Tiret spécial à la ligne {index} notamment, colonne {col}.', 'yellow'))
                sys.exit()

            # Commence par "%"
            elif cell_value.lstrip().startswith('%'):
                print(colored(f'Attention, "%" en début de ligne {index} notamment, colonne {col}.', 'yellow'))
                sys.exit()

print(colored('Vérification des caractères "très" spéciaux terminée en %s secondes !' % round(time.process_time() - timeNow, 1), 'blue'))
timeNow = time.process_time()
Filter/Extract
Field contains string
df2 = df1[df1['My field'].str.contains('AAA').fillna(False)]

print(tabulate(df2.head(5), headers='keys', tablefmt='psql'))
Field not contains a string
Just use ~:
df2 = df1[~df1['My field'].str.contains('AAA').fillna(False)]

print(tabulate(df2.head(5), headers='keys', tablefmt='psql'))
Field not empty, not NaN, not null
df_notEmpty= df[
    (df['My field'].notnull()) &
    (df['My field'].notna()) &
    (df['My field'] != '') &
    (df['My field'] != 'nan')
]
Field starts with
df2 = df1[df1['My field'].str.startswith('A')]

print(tabulate(df2.head(5), headers='keys', tablefmt='psql'))
Or:
df2 = df1[df1['My field'].str.startswith(('A', 'B'))]

print(tabulate(df2.head(5), headers='keys', tablefmt='psql'))
Field is a numeric value
# Function to extract numeric values
def extractNumericValue(my_text):
    my_values = re.findall(r'^-?\d+\.\d+|-?\d+$', str(my_text))
    if my_values:
        return my_values
    else:
        return None

# Apply
df['SearchNumericValue'] = df['My column'].apply(extractNumericValue)

dfResult = df[
        (df['SearchNumericValue'].notna()) &
        (~df['My column'].astype(str).str.contains('[a-zA-Z]', regex = True))
]

print(tabulate(dfResult.head(10), headers='keys', tablefmt='psql', showindex=False))
Field contains element from a list
Example searching space, star and parenthesis:
MySearch = ['\*', ' ', '\(', '\)']

df2 = df1[df1['zone'].str.contains('|'.join(MySearch)).fillna(False)]

print(tabulate(df2.head(40), headers='keys', tablefmt='psql', showindex=False))
Field equals element from a list
MySearch = ['Bbbb', 'XXX']

df2 = df1[df1['zone'].str.fullmatch('|'.join(MySearch)).fillna(False)]

print(tabulate(df2.head(40), headers='keys', tablefmt='psql', showindex=False))
Or like a SQL IN:
searchIn= ['AAA', 'BBB', 'CCC']

df2 = df1[df1['My field'].isin(searchIn)]

print(tabulate(df2.head(5), headers='keys', tablefmt='psql', showindex=False))
Field in digit
df2 = df1.loc[df1['zone'].astype(str).str.isdigit()]

print(tabulate(df2.head(5), headers='keys', tablefmt='psql'))
Several condition
Below we get lines with a field with null values and another field with empty values:
df2 = df1[(df1['My field'].isna()) | (df1['My other field'] == '')]

print(tabulate(df2.head(5), headers='keys', tablefmt='psql', showindex=False))
Get lines searching if values are IN a list
searchIn= ['AAA', 'BBB', 'CCC']

df2 = df1[df1['My field'].isin(searchIn)]

print(tabulate(df2.head(5), headers='keys', tablefmt='psql', showindex=False))
Field not finishes with a concatenation from other fields
Suppose you have this dataframe df:
| Language | |
| Python | docA-Python.pdf |
| SQL | docF-SQ.pdf |
| PHP | docS-PHP.pdf |
| CSS | docG-CSS.pdf |
| Javascript | docR-Javascript.pdf |
| HTML | docW-HTML.pdf |
Now you would like extract lines where the PDF field does not finish with [Language field] + '.pdf':
Compare = df[['Language', 'PDF']].apply(lambda x: x['PDF'].endswith(x['Language'] + '.pdf'), axis=1)

df_temp = pd.DataFrame(Compare)
df_temp.columns =['True or false']

df_concat = pd.concat([df, df_temp], axis=1)
df_filtered = df_concat[['Language', 'PDF']][df_concat['True or false'] == False]

print(tabulate(df_filtered.head(5), headers='keys', tablefmt='psql', showindex=False))
| Language | |
| SQL | docF-SQ.pdf |
Field not contains an email 😀
...
df_pb_Email = df[df['Email field'].str.contains(r'[^@]+@[^@]+\.[^@]+') == False]
...
Field not equals an email
...
df_pb_Email = df[df['Email field'].str.fullmatch(r'\b[A-Za-z0-9._%+-]+@[A-Za-z0-9.-]+\.[A-Z|a-z]{2,}\b') == False]
...
Field not contains a number
dfProblem = df[(df['My field'].astype(str).str.match(pat=r'^[-+]?[0-9]+$|^[-+]?[0-9]+\.[0-9]+$') == False)]
Field contains another field
df['A contains B'] = [x[0] in x[1] for x in zip(df['FieldB'], df['FieldA'])]
df= df[df['A contains B'] == False]
Field ends like another field
df['A finish with B'] = [x[1].endswith(x[0]) for x in zip(df['FieldB'], df['FieldA'])]
df= df[df['A finish with B'] == False]
Field with lenght equals a number
dfProbleme = df[
df['Field1'].str.len() != 7
]
Filter counting a string
How many times it appears in a cell:
dfCount = df[(df['Substitutions'].str.count('\\,') > 1)]
Regex
If the field is equal to (^...$) a number with a comma as decimal separator:
dfTest = df[df['My field'].str.match(pat='^\d+,\d+$')==True]
If the field starts (^) with different strings (...|...), using themselves different shapes ([...]):
dfTest = df[
    (df['My field'].str.contains(pat=r'^[tT]he animal')==True) |
    (df['My field'].str.contains(pat=r'^[aA]ny animal')==True) |
    (df['My field'].str.contains(pat=r'^([sS]ad|[hH]appy) animal')==True)
]
Extract a specific string
# Delete what is before SpecificString
df['NewField'] = df['OldField'].replace({'.*(?=SpecificString)': ''}, regex=True)

# Delete what is after SpecificString
df['NewField'] = df['NewField'].replace({'(?<=SpecificString).*': ''}, regex=True)
Extract names from email
from email_decomposer.EmailDecomposer import EmailDecomposer

email_decomposer = EmailDecomposer()

df[['first_name', 'last_name', 'host']] = df['email'].apply(
lambda x: pd.Series(email_decomposer.decompose(data=x, get_host=True)))
Split
Split column and get a element
Here, splitting with a comma (str.split(',')) and get the first element (.str[0]):
df['element'] = df['Myfield'].str.split(',').str[0]
Split column without to know how many column will result
df = pd.concat([
df['id'],
df['Field1'],
df['Field1'].str.split(';', expand=True).add_prefix('Field1_'),
df['Field2'],
df['Field2'].str.split(';', expand=True).add_prefix('Field2_')
], axis=1 )
Deduplication
Dedupe
To dedupe a dataframe on an Email field keeping only the first duplicate record, use drop_duplicates.
df['Email'] = df['Email'].str.lower()
dfDeduped = df.drop_duplicates(subset=['Email'], keep='first')
Find duplicates
Use duplicated:
df2 = df1[df1.duplicated(['My field'], keep=False)]

print(tabulate(df2.head(10), headers='keys', tablefmt='psql', showindex=False))
Find no-duplicates
df2 = df1[~df1.duplicated(['My field'], keep=False)]

print(tabulate(df2.head(10), headers='keys', tablefmt='psql', showindex=False))
Merge duplicates
df_Merge = df.groupby(['Field1', 'Field2'], as_index=False).agg({
'Field3': lambda x: ' - '.join(x),
'Field4': 'first',
'Field5': 'sum'
})
External scripts
Each time you can use def then import your functions (import... __main__...), just do it.
Otherwise, some tips to do in another way.
Import external scripts
Your working script needs to know where to find the external scripts:
sys.path.append('C:\\Users\\Georges\\PycharmProjects\\Your_Directory')

from YourScriptWithoutExtension import SomeVariables, ...
But I think all your sub-script will be executed like that.
Include external Python code (without real importation)
Here, at the exec, your sub-script will be executed, and your main script will continue just after.
...
YourFileCode = r'C:/Users/Georges/PycharmProjects/WorkEMC/YourFileCode.py'
...
exec(compile(open(YourFileCode, 'rb').read(), YourFileCode, 'exec'))
Namespace and __main__
If no namespace, so it takes the value __main__, but with an empty namespace, no.
namespace = {}
exec(compile(open(my_script, 'rb').read(), my_script, 'exec'), namespace)
And it is possible to add params or variable in the namespace.
Passing variables from one script to another without interference
Because just importing them, you will execute all scripts when you import.
So just use global variable, in your main script for example:
import os
os.environ['MY_VARIABLE'] = str(my_variable)
Then use it in other scripts like that:
import os os.environ.get('MY_VARIABLE')
Get the script executing
To know what script is executing another script as an import, in the imported script:
import inspect stack = inspect.stack() print(stack[-1].filename)
Manage parallel scripts execution
You have some scripts working, OK.
Then another main script to control them all, OK.
You want to run it multiple times in parallel and have already verified that your code's logic allows it (handling shared directories, shared files, shared tables, etc.). Okay!
Put your main script in a .bat file, like this for example:
"C:\Program Files\MyPythonVersion.exe" "C:\Users\Georges\PycharmProjects\my_main_script.py"
Then, manage script execution choosing a maximum processus number and according the CPU and RAM available, example:
import subprocess import psutil, time, sys, os from termcolor import colored from pathlib import Path from sqlalchemy import create_engine, text monFichierBat = userDirectory + 'PycharmProjects\\BDD_KF_v3\\FaisaibiliteAvancee\\AggregationParcelles\\auto.bat' engineBasic = create_engine('mysql+mysqldb://%s:%s@%s:%i/%s' % (userDb, mdpDb, hostDb, portDb, maDb)) nbreTraitementMax = 3 pctgUsageRam = 70 pctgUsageCpu = 50 rafraichirSeconde = 1 # CONVERTIR OCTETS EN GIGAS def octets_en_go(octets): return round(octets / (1024 ** 3), 2) # BOUCLE INFINIE/TEMPS RÉEL listeTraitementEnCours = [] while True: # USAGE MÉMOIRE print(colored('\n# USAGE MÉMOIRE', 'blue')) cpu = psutil.cpu_percent(interval=1) ram = psutil.virtual_memory() print('CPU utilisé à ' + str(cpu) + '%') print('RAM utilisée à ' + str(ram.percent) + '% (' + str(octets_en_go(ram.used)) + '/' + str(octets_en_go(ram.total)) + ' gigas)') # REGARDER S'IL Y A AU MOINS UNE DEMANDE EN ATTENTE checkSql = 'SELECT COUNT(*) AS nbr_wait FROM ma_table WHERE wait = 1 ;' with engineBasic.connect() as my_connection: nbrDemandeEnAttente = my_connection.execute(text(checkSql)).scalar() print(colored('\nActuellement ' + str(nbrDemandeEnAttente) + ' demande(s) en attente.', 'green')) # EXÉCUTER BAT (SANS ATTENDRE LA FIN DU PROCESS) # ET SOUS PLUSIEURS CONDITIONS if len(listeTraitementEnCours) < nbreTraitementMax and nbrDemandeEnAttente > 0 and cpu < pctgUsageCpu and ram.percent < pctgUsageRam : print(colored('\n# EXÉCUTER BAT (SANS ATTENDRE LA FIN DU PROCESS)', 'blue')) process = subprocess.Popen(monFichierBat, shell=True, stdout=subprocess.DEVNULL, stderr=subprocess.DEVNULL) print('Traitement lancé dans le PID:', process.pid) # LISTER LE TRAITEMENT EN COURS listeTraitementEnCours.append(process) # METTRE À JOUR LES TRAITEMENTS EN COURS print(colored('\nMETTRE À JOUR LES TRAITEMENTS EN COURS', 'blue')) for p in listeTraitementEnCours[:]: statut = p.poll() if statut is None: print('Le PID', p.pid, 'est en cours.') elif statut == 0: listeTraitementEnCours.remove(p) print(colored('Le PID ' + str(p.pid) + ' est terminé avec succès.', 'green')) else: listeTraitementEnCours.remove(p) print(colored('Le PID ' + str(p.pid) + ' est terminé avec une erreur :\n', statut, 'red')) print(colored('\nActuellement ' + str(len(listeTraitementEnCours)) + ' traitement(s) F2A en cours.', 'green')) time.sleep(rafraichirSeconde)
Warnings
Avoid indexation problems after dataframes concat
Sometimes after a dataframes concatenation, the indexes are melted and can cause some problems. Just ignore the index in your new dataframe:
df_Selections = pd.concat([firstSelection, secondSelection], axis=0, ignore_index=True)
Avoid copy warning (old)
import warnings from pandas.core.common import SettingWithCopyWarning warnings.simplefilter(action='ignore', category=SettingWithCopyWarning)
Avoid copy warning (new)
# Below importations, above your code pd.options.mode.chained_assignment = None
Avoid user warning
import warnings warnings.simplefilter(action='ignore', category=UserWarning)
Avoid future warning
import warnings warnings.simplefilter(action='ignore', category=FutureWarning)
Avoid VisibleDeprecationWarning
import warnings import numpy warnings.filterwarnings('ignore', category=numpy.VisibleDeprecationWarning)
Avoid PerformanceWarning
import warnings warnings.simplefilter(action='ignore', category=pd.errors.PerformanceWarning)
Command lines
Not related to Pandas but very useful to run shell command, bash, console scripts... We will use subprocess.
PSQL
With the trust method (see here):
import subprocess subprocess.run('psql -h localhost -p 5432 -d work -U postgres -c "SELECT NOW() ;"', shell=True)
Without the trust method, sending the Postgres password:
import subprocess import os env = os.environ.copy() env['PGPASSWORD'] = 'MyPassword!98464' subprocess.run(' psql -h localhost -p 5432 -d work -U postgres -c "SELECT NOW() ;"', shell=True, env=env)
For more complex queries, INSERT, UPDATE, JOINS... Set your SQL in a Python variable then:
myComplexInsert = ''' INSERT INTO myTable SELECT * FROM myOtherTable WHERE field_a IN ( SELECT field_b FROM myOtherOtherTable blablabla... ) ; ''' subprocess.run(['psql', '--quiet', '-h', 'localhost', '-p', '5432', '-d', 'work', '-U', 'postgres', '-c',myComplexInsert])
PgSql2Shp
subprocess.run( \ '''pgsql2shp -f E:\\Path\\to\\MyShape -u postgres -h localhost work "SELECT * FROM MyTable ;"''', \ shell=False, \ executable='E:\\Path\\to\\pgsql2shp.exe' \ )
Powershell
subprocess.run( \ '''OGR2OGR...''', \ shell=False, \ executable='E:\\Path\\to\\powershell.exe' \ )
Miscellaneous
Where is Python? Which version?
Some possibilities, for example:
import platform print('Python version:\n', platform.python_version()) import sys print('\nWhere is Python:') print(sys.executable) import sys print('\nPython version:') print(sys.version)
Create a dataframe from a previous dataframe (copy)
df2 = df1.copy()
Copy data from a dataframe in the clipboard
Very convenient to copy-paste quickly in a text file, CSV, Excel ...
df.to_clipboard(sep=',', index=False, header=None)
Get list from field
MyList = df['My field'].drop_duplicates().dropna().sort_values(ascending=True).tolist() print(MyList)
Get value from a cell
myValue = df.iloc[0]['my_field']
Get column names in a list
listColumn = df.columns.tolist()
Export a picture from a chart
And add a border.
from PIL import Image, ImageOps fig1.savefig('C:/Users/myplot.png', dpi=100) im = Image.open('C:/Users/myplot2.png') bordered = ImageOps.expand(im, border=1, fill=(0, 0, 0)) bordered.save('C:/Users/myplot2.png')
Re-organize columns
df = df[['Field 1', 'Adresse mail', 'Note algorithmique', 'Substitutions']]
Create column at a position
df.insert(0, 'New field', 'xxx')
Rename dataframe
New_df = pd.DataFrame(Old_df)
Rename columns
From their original name:
df.rename(columns={'Old name 1': 'New name 1', 'Old name 1': 'New name 1'}, inplace=True)
From their position:
df.columns.values[12] = 'New name'
Delete column
df.drop('My field', axis=1, inplace=True)
Format number with space thousand separator
number = df.shape[0] print(format(number, ',').replace(',', ' '), 'customers')
Or:
f"{number_of_rows:,}".replace(',', ' ')
Ranking
To rank according to a field, from highest to lowest:
df['My rank'] = df['My field to rank'].rank(ascending=False)
Avoid duplicate:
df['My rank'] = df['My field to rank'].rank(ascending=False, method='first')
Generate a unique random integer
If you want a unique random integer from 1 included to the number of records included.
import numpy as np howManyRecord = df.shape[0] df['Random number'] = np.random.choice(range(howManyRecord), howManyRecord, replace=False) df.loc[df['Random number'] == 0, 'Random number'] = howManyRecord
Select with condition
df = df.loc[df['Field to filter'] == 'Yes']
Prevent nan
Use keep_default_na=False :
Data = pd.read_excel(inputExcelFile, sheet_name='Feuil1', engine='openpyxl', keep_default_na=False)
Replace the default NA value
Data = pd.read_excel(inputExcelFile, sheet_name='Feuil1', engine='openpyxl', keep_default_na=False), na_values=['_'])
Get data like a SQL UPDATE
Very usefull to build SQL update queries from a file with the primary key in first column :
file1 = open(MyPath+'FixQueries.sql', 'w', encoding='cp1252') # ÉCRITURE DU FICHIER for i in df.itertuples(index=False): file1.write('UPDATE MyTable SET ' +\ str(i)[7:-1].split(', ', 1)[-1] +\ " WHERE id = '" + i[0] + "' ;\n")
Get data like a SQL INSERT
# SQL TO INSERT IN TARGET for index, row in df.iterrows(): columns = ', '.join(row.index) values = ', '.join(f"'{v}'" for v in row.values) query = f'''INSERT IGNORE INTO ma_table ({columns}) VALUES ({values}) ;''' print(query)
Use index in concatenation
df.index.astype(str)
Reset index
df.reset_index(drop=True, inplace=True)
Drop index
To drop the index, you have to use another field as index.
df = df.set_index('my field')Open a box to enter a string and use it as a variable
import tkinter as tk from tkinter import simpledialog window = tk.Tk() window.eval('tk::PlaceWindow . center') window.withdraw() repertoireCarto = simpledialog.askstring("Saisie", "Répertoire ?\t\t\t\t", parent=window) print('Le répertoire est', repertoireCarto)
Get some line indexes according condition
list_duplicate = df.index[df['My field'] == 'Text'].tolist()
Strings comparison
Compare the similarity of 2 strings, to get a indicator in a new field:
import difflib from difflib import SequenceMatcher df['indicator'] = df[['Field1', 'Field2']].apply(lambda x: SequenceMatcher(lambda y: y == " ", x[0], x[1]).ratio(), axis=1)
Count time execution
import time ... print('Time for now is %s secondes' % round(time.process_time(), 1)) timeNow = time.process_time() ... print('Time now is %s secondes' % round(time.process_time() - timeNow, 1)) timeNow = time.process_time() ...
Concatenate fields without empty value
df['adresse'] = df[['Filed1', 'Filed2', 'Filed3']].apply(lambda x: ' '.join(x.dropna()), axis=1)
Force data type creating the dataframe
df = pd.read_csv(workDirectory + FileName, sep=';', usecols=fieldsExisting, dtype={'firstname': 'str', 'lastname': 'str'} )
- Tips:
- Sometimes when your data comes from an Excel file and contains percentages,
dtypewill be non-efficient because Excel stores percentages as numbers. There is a solution in the chapter Advanced read/write in Excel of this article, just search Fix Excel percentages.
Fix scientific notation for phone numbers in Pandas, Tabulate and Excel export
Example for phone numbers:
df['Mobile Phone'] = df['Mobile Phone'].astype(str) df['Mobile Phone'] = df['Mobile Phone'].fillna('') df['Mobile Phone'] = df['Mobile Phone'].replace(['nan'], '') df['Mobile Phone'] = df['Mobile Phone'].apply(lambda x: x[:-2] if x.endswith('.0') else x)
Fix scientific notation in print with tabulate
Only work for float column, use floatfmt:
print(tabulate(df.head(10), headers='keys', tablefmt='psql', showindex=False, floatfmt='.10g'))
Get file/directory date creation
import os import time from time import gmtime, strftime myRep = 'C://Path/of/my/directory' myDateCreation = time.ctime(os.path.getctime(myRep)) print('\n' + str(myDateCreation)) myConvertDateCreation = time.strptime(myDateCreation) print("\nFull:", myConvertDateCreation) print("\nDay:", myConvertDateCreation.tm_mday) print("Month:", myConvertDateCreation.tm_mon) print("Year:", myConvertDateCreation.tm_year) print("Hour:", myConvertDateCreation.tm_hour) print("Minutes:", myConvertDateCreation.tm_min) print(strftime("\n%A %d %B %Y %H:%M", myConvertDateCreation ))
Use a dataframe not yet created in a function
Pass it as global:
def MyDeletion(): global df ind_drop = df[df['My field'].apply(lambda x: x == ('My value'))].index df = df.drop(ind_drop)
Organize your screens (new, OK for W11 for example)
import subprocess import pygetwindow as gw import time import os import psutil # CLOSE PREVIOUS WINDOWS TARGET = "explorer.exe" [process.kill() for process in psutil.process_iter() if process.name() == TARGET] # OPEN A WINDOW subprocess.Popen('explorer "C:/Users/Downloads"') time.sleep(0.5) # SEE WINDOWS TITLES windowsList = gw.getAllTitles() # DELETE USELESS THINGS IF CONTAINS windowsList = [x for x in windowsList if 'Notepad' not in x] # DELETE USELESS THINGS IF EQUALS windowsList = [element for element in windowsList if element != ''] print('My windows : ' + str(windowsList)) # MOVE A WINDOW for window in windowsList: if window == 'Downloads: File explorer': explorateur = gw.getWindowsWithTitle(window)[0] explorateur.resizeTo(500, 505) # width, height explorateur.moveTo(11, 15) # from left, from right
Organize your screens (old, see below for a better way)
Attention: wait the end of the process for proper screens!
import subprocess import clipboard import pyautogui import pygetwindow as gw from screeninfo import get_monitors # Callback function to find file explorer windows def enum_windows_callback(hwnd, results): if win32gui.GetClassName(hwnd) == 'CabinetWClass': results.append(hwnd) return True # Get all File Explorer windows explorer_windows = [] win32gui.EnumWindows(enum_windows_callback, explorer_windows) # Close every File Explorer window for hwnd in explorer_windows: # Activate window win32gui.ShowWindow(hwnd, win32con.SW_SHOW) win32gui.SetForegroundWindow(hwnd) # Use pyautogui to send Alt+F4 key combination to close window pyautogui.hotkey('alt', 'f4') # Open File Explorer subprocess.call("start explorer", shell=True) # Wait a short while for File Explorer to fully open pyautogui.sleep(1) # Select the desired screen (for example, the first screen) monitors = get_monitors() screen = monitors[0]# Récupérer les coordonnées du coin supérieur gauche de l'écran left = screen.x top = screen.y # Find the File Explorer window explorer_window = gw.getWindowsWithTitle('Explorateur de fichiers')[0] # Desired position on the screen pyautogui.sleep(0.5) x_position = 10 # To the right y_position = 15 # To the down explorer_window.moveTo(x_position, y_position) # Size pyautogui.sleep(0.5) width = 600 height = 600 explorer_window.resizeTo(width, height) # Directory pyautogui.sleep(0.5) directory_path = 'C:\\Users\\Georges\\Downloads' clipboard.copy(directory_path) pyautogui.hotkey('alt', 'a') # pyautogui.typewrite(directory_path) pyautogui.hotkey('ctrl', 'v') pyautogui.press('enter') # pyautogui.click(button='right') # subprocess.call("start notepad", shell=True)C:\Users\Georges\Downloads
Search a string in database
from tabulate import tabulate as tab import pandas as pd from sqlalchemy import create_engine SearchWord = 'anyxxxtube' username = 'XXXXX' password = 'XXXXX' port = 3306 database = 'XXXXX' host = 'XXXXX' engine = create_engine('mysql+mysqldb://%s:%s@%s:%i/%s' % (username, password, host, port, database)) # SEARCH TABLES AND FIELDS sql = 'SELECT table_name, column_name FROM INFORMATION_SCHEMA.COLUMNS WHERE table_name LIKE "prime_%%" ;' df = pd.read_sql_query(sql, engine) print(tab(df.head(5), headers='keys', tablefmt='psql', showindex=False)) print(df.shape[0]) # BUILD QUERIES Assemblage = list(zip(df['table_name'].tolist(), df['column_name'].tolist())) # for a, b in Assemblage: # print(a, ' - ', b) for a, b in Assemblage: sql = 'SELECT '' + b + '' FROM '' + a + '' WHERE '' + b + '' LIKE "%%' + SearchWord + '%%" ;' df = pd.read_sql_query(sql, engine) if df.shape[0] > 0: print('In table "' + a + '" :') print(tab(df.head(5), headers='keys', tablefmt='psql', showindex=False)) print(df.shape[0])
Name dataframes dynamically
In a loop for exampe, with globals():
ListFiles = ['Stats Name1.xlsx', 'Stats Name2.xlsx'] for f in ListFiles: dfTemp = pd.read_excel(outputDir + f, sheet_name='Sexe', engine='openpyxl') name = f.replace('.xlsx', '').replace('Stats ', '') globals()[name] = dfTemp print('\n' + name + ' :') print(tabulate(globals()[name].head(35), headers='keys', tablefmt='psql', showindex=False))
Generate a unique random ID
import uuid unique_id = str(uuid.uuid4())
Empty folder, empty a dir
from pathlib import Path import shutil repertoire = Path('C:/mon_dossier') for element in repertoire.iterdir(): if element.is_file() or element.is_symlink(): element.unlink() elif element.is_dir(): shutil.rmtree(element)
Migrations
Some tips to switch from Pandas 1.x to 2.1.1, with SqlAlchemy 2.0.21 and Python 3.9 (and maybe Python 3.11)
ImportError: cannot import name SettingWithCopyWarning from pandas.core.common
It can happens if you use:
import warnings from pandas.core.common import SettingWithCopyWarning warnings.simplefilter(action='ignore', category=SettingWithCopyWarning)
Now prefer:
import pandas as pd ... pd.set_option('mode.chained_assignment', None)
And if you script is loaded from several Python versions, you can do:
import pandas as pd ... pandas_version = pd.__version__ if pandas_version >= '2.1.1': pd.set_option('mode.chained_assignment', None) else: import warnings from pandas.core.common import SettingWithCopyWarning warnings.simplefilter(action='ignore', category=SettingWithCopyWarning)
sqlalchemy.exc.ObjectNotExecutableError: Not an executable object
It can happens when you execute a query from a string, example:
from sqlalchemy import create_engine from _params import my_username, my_password, my_host, my_port, my_database my_engine = create_engine('mysql+mysqldb://%s:%s@%s:%i/%s?charset=utf8mb4' % (my_username, my_password, my_host, my_port, my_database)) my_connection = my_engine.connect() my_query = my_connection.execute('SELECT 1 FROM mytable ;')
Just put your SQL query in text:
from sqlalchemy import create_engine, text from _params import my_username, my_password, my_host, my_port, my_database my_engine = create_engine('mysql+mysqldb://%s:%s@%s:%i/%s?charset=utf8mb4' % (my_username, my_password, my_host, my_port, my_database)) my_connection = my_engine.connect() my_query = my_connection.execute(text('SELECT 1 FROM mytable ;'))
Specify dtype option on import or set low_memory=False
Specify low_memory when you read your file:
df = pd.read_csv('your file.csv', low_memory=False)FutureWarning: The behavior of DataFrame concatenation with empty or all-NA entries is deprecated
It can happens if you do a pd.concat, something like:
df_1 = ... df_2 = ... df_3 = ... df = pd.concat([df_1, df_2, df_3], axis=0)
Prefer that:
ListMyDfs = ['df_1', 'df_2', 'df_3'] df = pd.DataFrame() for MyDf in ListMyDfs: if not globals()[MyDf].empty: df = pd.concat([df, globals()[MyDf]], axis=0)
| [France-Departements-Deformation] | 335 Ko | |
| [simple_countries] | 1880 Ko |